
Figure 0.1: The continuous color hue spectrum
Education Studies
University of California, San Diego
URL for this paper: http://pages.ucsd.edu/~jalevin/landmark-mediation/
Models of human cognition and learning have been largely static, using simple causal relations to capture the dynamic character. Dynamic properties are difficult to represent on paper, which is fundamentally a static medium. In this interactive paper, I will describe a interactive framework of representation and mediation expressed in a multi-agent computer simulation system that has the potential to capture more effectively these dynamics. The representational and process framework will be introduced in the domains of color, orientation, number, and spatial representation of simple shapes. The basic concepts of representation and mediation presented here may have applicability in broader contexts.
There has been a continuing debate about the representation of things that vary on a continuum with discrete concepts. Many of the aspects of the world vary in ways that are perceived as continuous. However these continua are perceived by organisms with neural systems consisting of discrete neurons. So the challenge is to build a simulation system that is able to represent points on a continuum and changes in values along a continuum with discrete elements.
Rosch (1973) conducted a set of studies of color perception across a variety of cultures, that supported the concept of color "prototypes". So even though color hue is physically a continuously changing quantity (at the level of analysis of human perception), the perception of color involves color "prototypes", discrete entities that mark out the space of color hue. This seems to be pretty strong evidence for the discrete representation of color; however people do in fact perceive a continuum of color hue. How can we reconcile these two aspects of color perception?
In this interactive paper, I will introduce a framework for representation, called "landmark representation" and a framework for processing, called "interactive mediation", that characterize a distributed activity approach to thinking and learning. These new frameworks will be illustrated with NetLogo Web files, which are HTML5 files that can be accessed over the web that allow the reader to take an active role in exploring the dynamic nature of these frameworks. The files were created in NetLogo (Wilensky, 1999), a powerful multi-agent modeling environment that is cross-platform, freely available and allows simulations to be saved as HTML5 web files that can be accessed and run over the Web. In each case, if you are reading this paper through the web, you can click on a link or figure to start up one of these files. Thes files are fairly large, so may take a while to load. If you are reading this paper in print format, you may want to access the web version at the same time (or at some point, if it is not possible right now) and try out the web files. The URL for the web version is: http://pages.ucsd.edu/~jalevin/landmark-mediation/
Color landmarks. Color hue varies in a continuous way, as shown in Figure 0.1.
Figure 0.1: The continuous color hue spectrum
But there are obvious landmarks, suggested in fact by the discrete way that the eye perceives color, with three distinct color receptors in the retina. This discreteness is also represented by the naming system we have for colors, as shown in Figure 0.2.
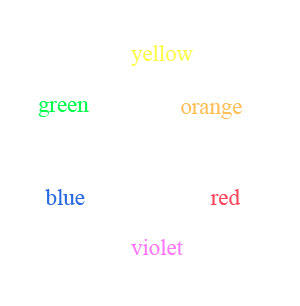
Figure 0.2: Discrete color names
So the challenge is to represent a continuum like color in a way that captures both the continuous nature of the continuum and the discrete nature of the categorical system associated with it, in an integrated way.
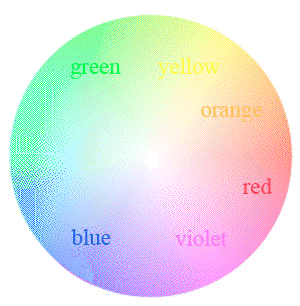
Figure 0.3 Discrete and continuous color
For example, how can we represent the color "red"? We can have a concept for "red", and the activity level value of that concept represents how intense the red is. The activity level is a number that varies from 0 (complete inactivity) to some maximum number (maximum activity level). Now if we have two color landmarks, let's say for "red" and for "green", then we can represent not just those two landmark colors, but any intermediate color by different ratios of activity level values for the two landmarks. So a color half-way between red and green would be represented by the situation in which the activity level of the two color landmarks are equal, as illustrated by the web file shown in Figure 1 below. In that figure, the two landmarks, Red and Green, are represented as two circles, and the activity level of each is shown by the number within the circle for each landmark and by the intensity of the color of each circle. Click on the figure below or this link to start the web file so that you can actively see how different ratios of activity level can represent the colors that are between red and green.
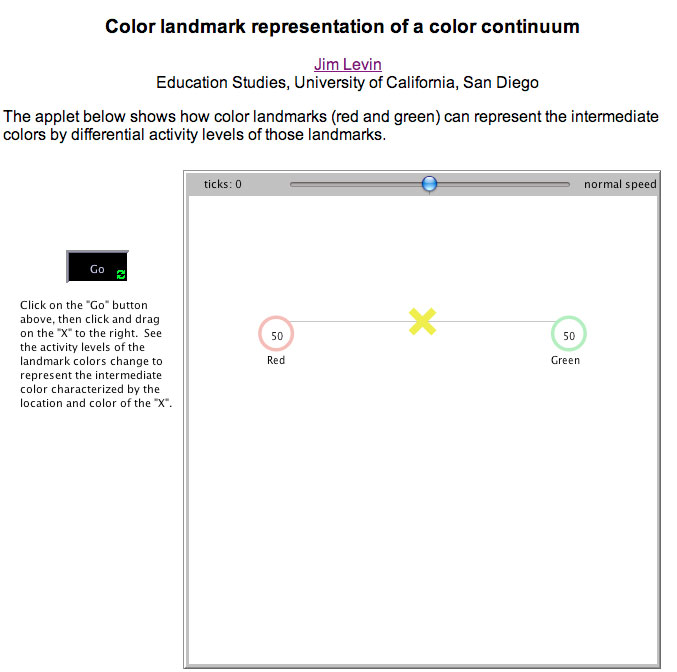
Figure 1: An web file that shows the representation of a color
continuum with two color landmarks.
So, a color half way between red and green is yellow. As you move the marker closer to the Red landmark, the Red landmark becomes more active relative to the Green landmark, and the color hue represented is more orange. As you move the marker closer to the "Green" landmark, the "Green" landmark becomes relatively more active, and yellowish-green hues are represented. So with these two landmarks, we can represent a continuum of color hues
We are not limited to just two landmarks. Figure 2 shows an web file that illustrates the representation of color hue with three landmarks: red, green, and blue, with each represented by a circle.
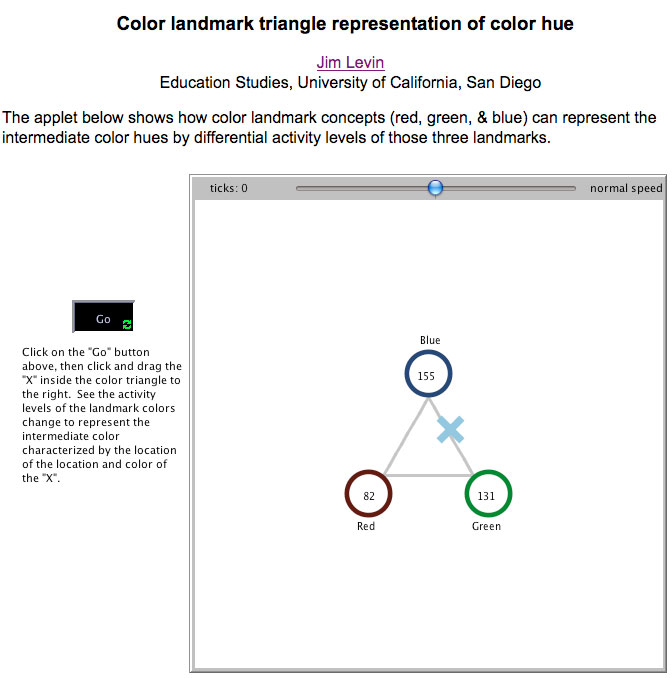
Figure 2: An web file that shows the representation of a color
plane with three color hue landmarks.
As you move the "X" around in the plane defined by the three color landmarks, the color of the "X" changes to indicate the color hue represented by the particular ratio of activity levels of the landmarks. As in Figure 1, the activity level of each of the three landmarks is indicated by the number inside each circle and by the intensity of the color of each circle.
This landmark representation framework is also not limited to three landmarks. A difference between those with more expert knowledge of color and those will less expertise could well be the larger number of color hue landmarks a more expert person has, and we can imagine a developmental process in which a relative novice with few color landmarks acquires color hue expertise through the acquisition of more and more color hue landmarks. So a relative novice would have color hue landmarks for common colors such as yellow and orange, while an expert would have acquired more sophisticated color landmarks such as teal (a dark to medium greenish blue) and mauve (a pale bluish purple). Both would be able to represent the continuum of color hue, but the expert would be able to make finer discriminations between colors.
A landmark representation of orientation.
It isn't just the color continuum that can be represented with landmarks. There is also a continuum of directional orientations, which in a plane are captured by the principle compass points of north, east, south, and west. This directional orientation continuum can be represented by these four landmarks, with intermediate orientations represented by the simultaneous activity of two or more of these orientation landmarks. Figure 3 is an web file that shows this orientation representational system, representing the orientation of northeast.
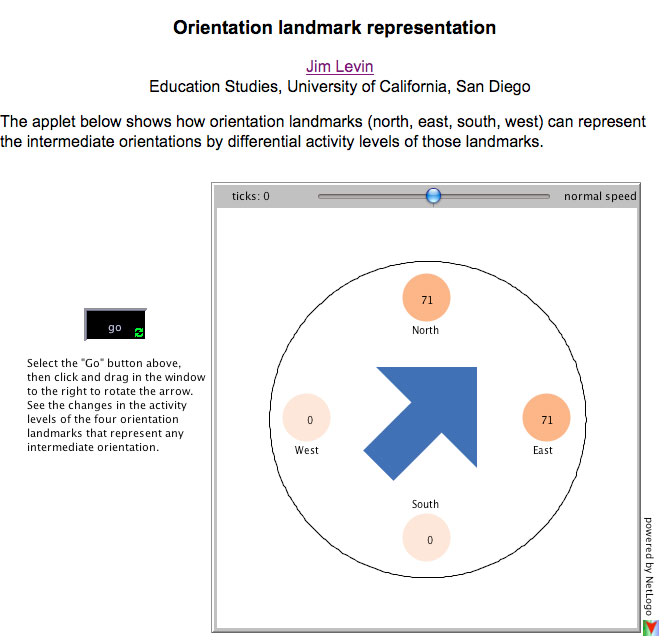
Figure 3: An web file that shows the representation of planar
orientation, with four orientation landmarks.
A landmark representation of the number line.
Moving to a more abstract domain, a prototypical continuum is the number line. We can capture the infinite number of numbers represented by the number line by a finite number of numeric landmarks. Figure 4 is an web file that shows this number line representational system, with the number 500 represented as equal activity levels of the landmarks 0 and 1000.
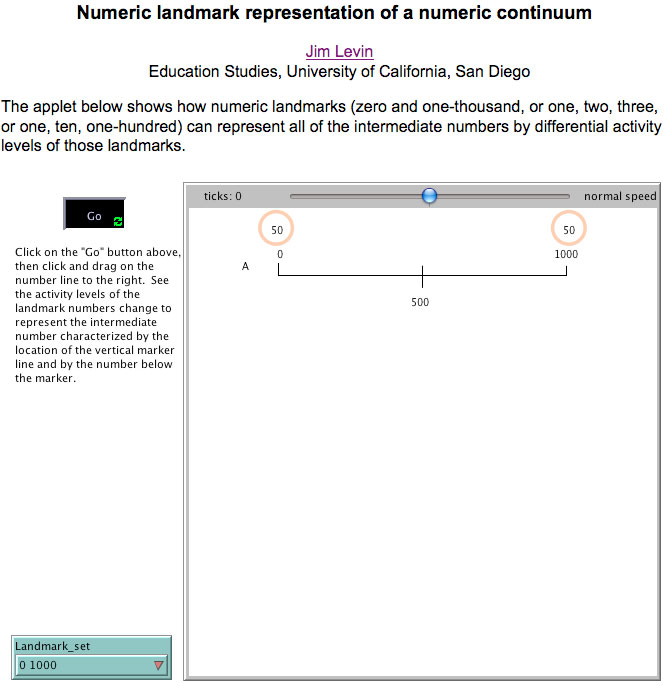
Figure 4: An web file that shows the representation of the number 500 with
equal activity levels of landmarks "0" and "1000".
Recent research on children's representation of number concepts by Siegler and Opfer (2003) has shown that young children represent numbers on the positive number line in an exponential way, then move gradually to a linear way as they develop. Siegler and Opfer have argued for two different representational systems, with development shifting from one to the other with increasing mathematical experience (Siegler & Opfer, 2003). With the"landmark" representational system presented here, we can model this same developmental process with just one representational system, by having young children starting with just a few numeric landmarks and gradually acquiring more and more numeric landmarks. In particular, if they acquire the landmarks featured by the place value system early in the process (1 10 100 1000 10000 ...), then their numeric performance would look like they had an exponential model. As they acquired more and more landmarks, especially integer landmarks, their performance would look more and more linear.
This numeric landmark web file allows you to choose other sets of landmarks, including "1 2 3" and "1 10 100". Figure 5 illustrates of the landmark set "1 2 3" with activity levels of the three landmarks representing 2.5.
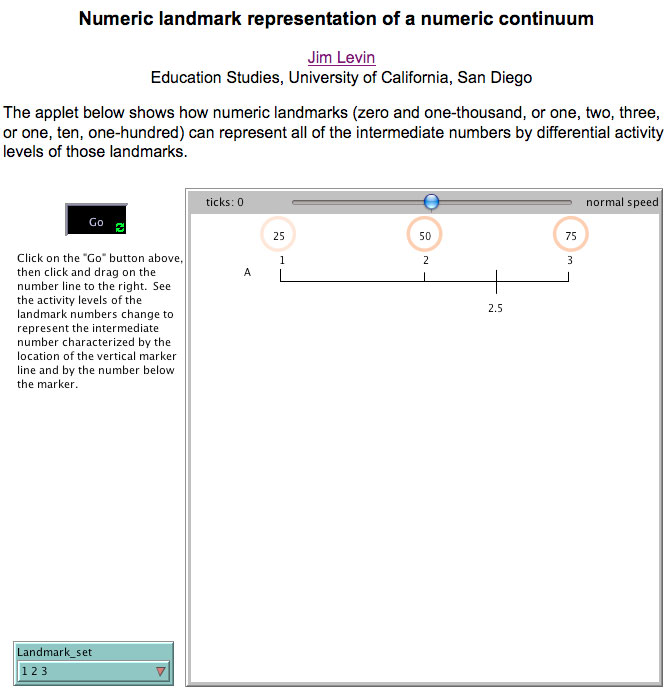
Figure 5: A representation of the number 2.5 as the differential activity of
three numeric landmarks, 1, 2, & 3.
Now an alternative representation of that same number 2.5 would be to have equal activity levels for the two closest landmarks, 2 and 3. In fact, with this representational system, there are an infinite number of different representations for the same number. Figure 6 shows an web file that allows you to select a number to be represented, and then to see the different ways that that number is represented by changing the standard deviation of a Gaussian distribution with the represented number as the mean value.
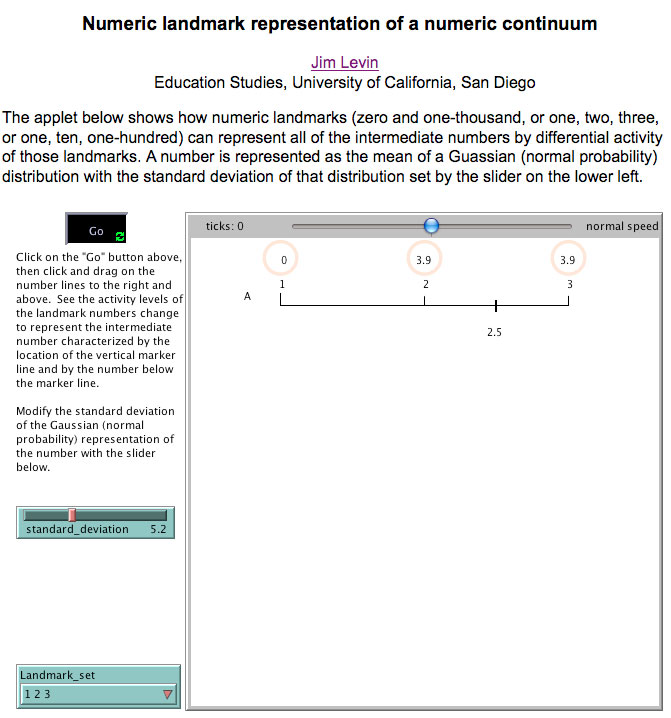
Figure 6: A representation of the number 2.5 with a different set of activity
levels
of three landmarks: 1, 2, & 3.
So this landmark representational system not only allows the representation of any value on a continuum, but it also allows the representation of the variability or uncertainty of the value. It can represent more certain knowledge about a value by activity of immediately neighboring landmarks; it can represent less certain knowledge about a value by the activity of more than just the neighboring landmarks.
This multiple representation property is also true for for other continua. Figure 7 shows an web file that allows the specification of variability for color hue landmark representation.
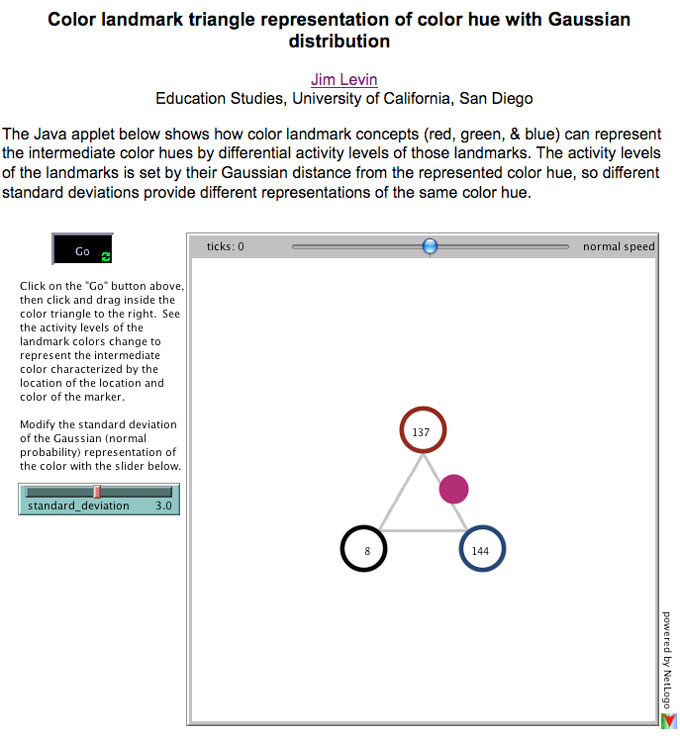
Figure 7: An web file showing the representation of color hue with specifiable
variability.
If you compare Figure 7 with Figure 2, you can see that a smaller variability leads to a darker hue. If you click on Figure 7, you can see the effect of changing the standard deviation for any given color hue.
Generalization and differentiation.
When presented with two or more stimuli, organisms are presented with two different challenges. One is to identify the similarities between the different stimuli; another simultaneous challenge is to identify differences. In one case, the challenge is to generalize across multiple instances of a stimulus; in the case, the challenge is to differentiate between different stimuli. With the landmark representational framework presented here, there is a simple basic mechanism for modeling these generalization and differentiation processes. With two (or more) instances of a value on a continuum represented by a set of landmarks, a model for generalization is to simply combine the activations of the landmarks for the different values to be generalized across in an additive way (through combined excitation). In an analogous way, a model for differentiation is to combine the activations of the landmarks for the different values to be differentiated by subtracting the activity levels of all the landmarks representing one of the values from the activity levels of the all the landmarks of the other value (by a combination of excitation and inhibition). Figure 8 shows this for numbers represented by numeric landmarks.
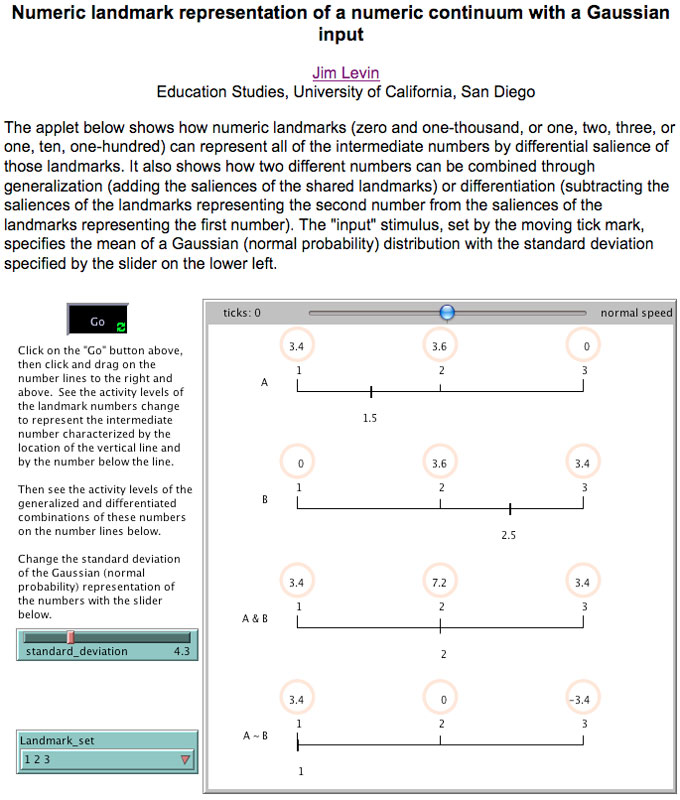
Figure 8: Generalization and differentiation of numbers represented by numeric
landmarks.
In this numeric domain, the generalization model basically determines the mean value of the two numbers being generalized. The differentiation model is a kind of "rounding", pushing the first value toward the nearest landmark away from the second value.
This same kind of generalization and differentiation can be applied in other domains as well. Figure 9 shows these models of generalization and differentiation in the domain of color hue representation.
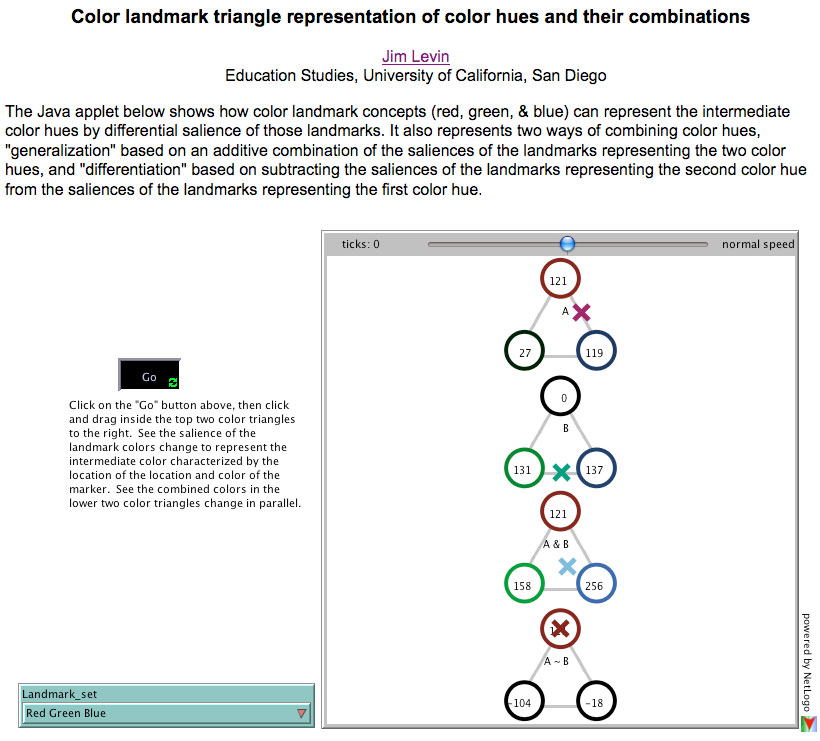
Figure 9: Generalization and differentiation of color hues represented by color
hue landmarks.
Landmark representation of spatial concepts and interactive mediation.
We have seen how values on a number line can be represented by landmarks and their differential activity. Let's now look again at lines (actually line segments) as spatial entities. There are a number of mathematical and geometric definitions of a line (and line segment). What would be a landmark representation of a line segment? Figure 10 shows one such representation.
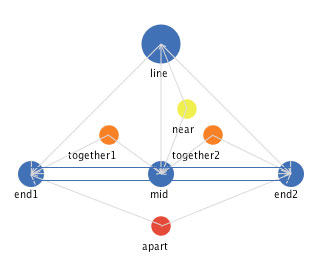
Figure 10: A landmark representation of a line segment.
In this landmark definition, a line is defined as having three landmark subparts, a mid and two ends. But what are the other things in Figure 10? There are three new entities, all of which are spatial mediations among the subparts and between the line concept and subparts. "Near" is a strong proximity mediator, that operates to bring together its immediate neighbors into a common place. "Together" is a weaker proximity mediator, that operates to bring together its immediate neighbors, but not as strongly as the "near" mediator. The third mediator "apart" is a mediator that operates to move its immediate neighbors apart from itself (and thus from each other). What would we predict if all of these mediators operated simultaneously on the line and its landmark subparts? Figure 11 shows an web file that implements these mediators.
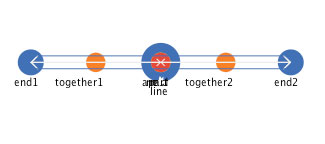
Figure 11: An web file that implements a landmark subpart definition of a line
segment with spatial mediators.
It is difficult to convey in a static medium the dynamic properties of this interactive mediational representation of a line segment. There are two properties that are clear from interaction with the dynamic representation of the web file: self-repair and self-organization. While interacting with the web file, if you select some subpart or some mediator and move it then let it go, you will see the line segment "self-repair". That is, the moved component will operate on its immediate neighbors to restore its specified relationships, and the other components will simultaneously operate to restore their specified relationships. The line segment will restore itself, although in a different position and/or orientation. The second, related, property of this dynamic representation is "self -organization". When interacting with the web file, if you select the "Scramble" button, all of the components will be moved to a random location within the space. Figure 12 shows a scrambled state of the line concept.
Figure 12: A randomized state of the line segment representation.
Then, selecting the "Go" button leads to a dynamic interaction of all the components, leading to the stable state shown in Figure 13.
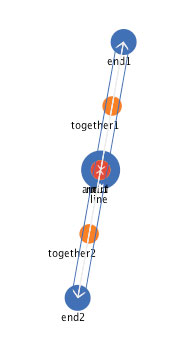
Figure 13: A self-organized line segment representation.
Another interesting property of this interactive mediator representation of a line segment is the definition of length of the line, which can be manipulated by the line length slider. The length of a line segment in this representation is a "dynamic stability" property, the balance between the strength of attraction exerted by the "together" mediators and the strength of repulsion exerted by the "apart" mediator. The stronger the "apart" mediator, the longer the line segment's length; the stronger the "together" mediators, the shorter the length
The interactive mediation of more complex spatial shapes.
Can we use this same interactive mediation with landmark representation system to represent more complex shapes? Figure 14 shows a representation of the Roman letter "A".
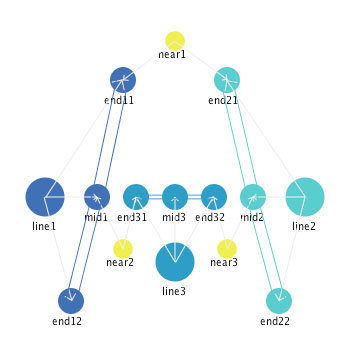
Figure 14: A representation of the letter "A".
The letter "A" is defined as having three lines as components, with the spatial mediator "near" specified between pairs of landmark subparts of these three lines. The end of line 1 is "near" the end of line 2, thus specifying the apex of the letter "A". The cross-line is line 3, with one end "near" the the mid of line 1 and the other end near the mid of line 2. Figure 15 shows the stable state reached when all the mediators simultaneously operate.
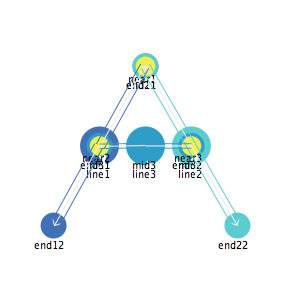
Figure 15: The stable state of the interactive mediation of the
letter "A".
The "straightness" of the lines, represented explicitly in figures 10 through 13, is "built-in" to the concept of "line" in figures 14 and 15, as a kind of proceduralization of the mediation. The letter "A" is both self-repairing and self-organizing, in the same way described above for a simple line. If one of the components of the "A" is moved, the component is moved back into place by its interactions with the other components. At the same time, the other components are moved in a lesser degree, leading to translation and/or rotation of the overall letter in the process of self-repair. If the components of the letter "A" are randomized with the "Scramble" button, the components interact with each other to "self-organize" the spatial definition of the letter, which will appear in a random orientation and location. Figure 16 shows some screenshots of the process of self-organizing.
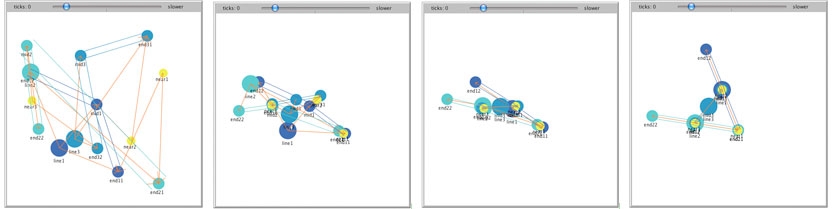
Figure 16: Steps in the process of the self-organization of a scrambled letter
"A".
This spatial representation and the ones that follow are structural descriptions of spatial shapes (Palmer, 1999). In fact, this representation of an "A" is very similar to Figure 8.2.15 in Palmer's book "Vision Science" (Palmer, 1999, p. 394), which is reproduced with permission as Figure 16.1.
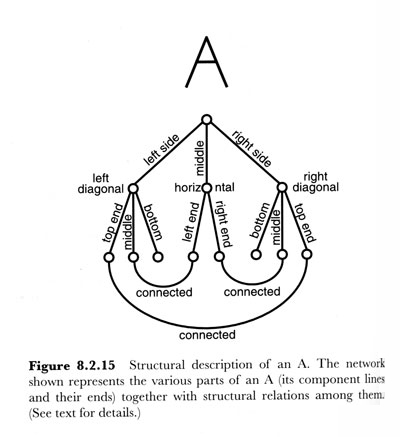
Figure 16.1: Palmer (1998) structural description of the letter A.
It is also similar to a set of representations that I sketched out in an unpublished paper many years ago (Levin, 1973). The representation of the letter A is shown in Figure 16.2.
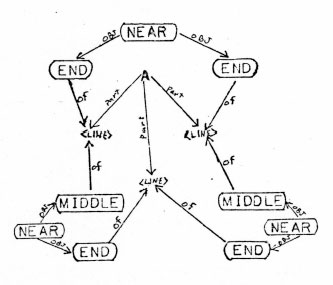
Figure 16.2: Levin (1973) structural representation of the
letter A.
The major difference between the representations in this paper and previous structural representations is that this is an interactive structural representation with multiple simultaneously operating mediators acting to maintain or organize the spatial shape.
Oriented shapes.
While it is useful to have an orientation-free representation of a letter, to assist in the recognition and production of the letter in non-canonical orientations, it is also useful to have an orientation-specified representation. Figure 17 shows a representation of an upright-oriented letter A, created by adding the orientation mediator "above" between the apex of the A and the mid of the cross-point.
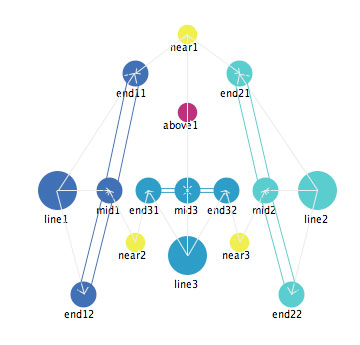
Figure 17: An interactive mediational representation of an upright A.
If the letter A is not upright, the "above" mediator will operate to rotate the letter, through its impact on its immediate neighbors, the intersection of the apex of the A (represented by the mediator "near1") and the mid point landmark of the cross-bar line 3. The "above" mediator pushes the "near" mediator upward and the "mid" mediator downward, and through those pushes, exerts torque that rotates the letter into an upright orientation.
"Invisible" lines as structural constraint mediators.
Let us look at the representation of other letters. Suppose we wanted to represent the letter "L". Figure 18 shows a simple representation of the letter.This representation is the same as the one that I specified many years ago in the appendix of the Levin (1973) paper. Once the web file starts, select "an-overly-simple-L" from the selection box at the bottom left, then click "Go".
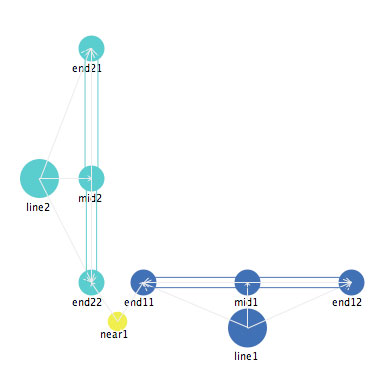
Figure 18: An overly simple representation of the letter L.
However, if you move one of the components of this overly simple representation, you will find that it does not self-repair into the letter L, since the proximity mediator "near" keeps the two ends of the two lines together, but not at a right angle. Instead it operates as a "hinge", allowing the two lines to take any orientation in relation to each other. This representation captures part of the spatial character of the letter "L" but not all of it.
One thing that can be learned from the representation of the "A" shown above is the power of triangles to provide stability. So one way to represent a stable right angle that is characteristic of the letter "L" is to add an "invisible" line that creates a triangle. This invisible line is sort of like the "construction" lines used in geometric proofs. Figure 19 shows an web file that captures the property of the right angle in an "L". Once the web file start, select "L" from the "Which_shape" set of choices at the bottom left.
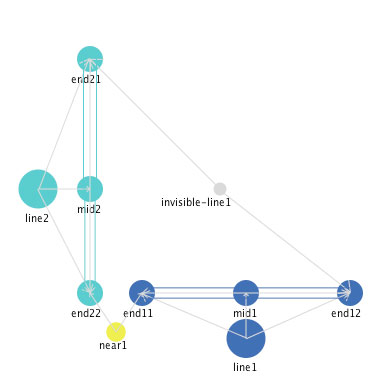
Figure 19: A self-organizing, self-repairing representation of the letter L.
Bi-stable representations.
Sometimes a randomized letter "L" will self-organize into a normal letter "L" as shown in Figure 19, perhaps in a different location or orientation, and sometimes it will self-organize into a reversed letter "L" as shown in Figure 20.
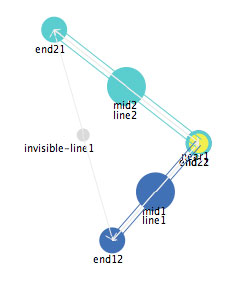
Figure 20: A representation of a reversed "L".
If you move components of this reversed "L", in many case it will "self-repair" back into a reversed "L". You can make quite large changes without leading to a reorganization into a normal "L". However, if you move one of the ends of one of the lines to the other side of the other end, then this representation will reorganize into a normal "L".
Reversal isn't the only bi-stable state. We can define the letter "X" as two straight lines for which the middles are near each other, and the appropriate ends are apart from each other. This is shown in Figure 21. Once the web file starts, select "X" from the "Which_shape" choices at the bottom left.
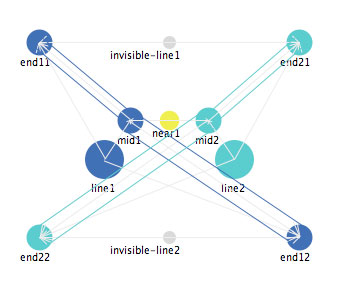
Figure 21: A representation of the letter "X".
There are two different stable states for such a representation. One is the one in which the two line segments cross each other; another is one in which the two line segments approach each other and then diverge from each other, forming two "V" shapes that are joined. These two stable states are shown in Figure 22.
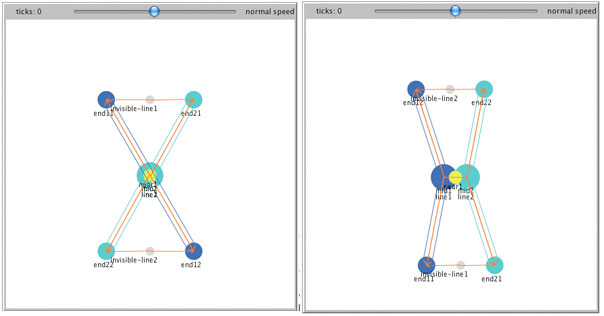
Figure 22: Two stable states of the representation of the letter "X".
More complex lines and approximations to curves.
So far, we've only represented letters that involve straight lines. Do we need to introduce the concept of continuous curves? One way to represent continuous curves is by adding more and more landmarks to a line segment, landmarks that allow the line segment to "flex" at those landmark points. Figure 22.1 shows a more complex line, with five subpart landmarks instead of the three subparts landmarks of the simple line segment shown above.
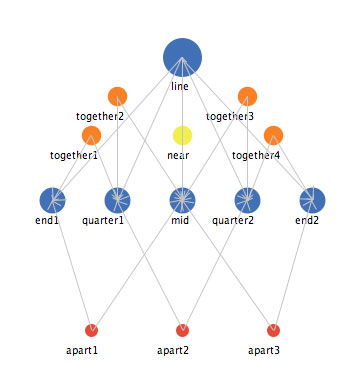
Figure 22.1: A more complex line segment.
When you click the "Scramble" button, you can see the line flex while it is self-organizing, sometime needing to "unfold" in order to create linearity.
Now we can use this more complex line to construct letter shapes that require a curved line, where this complex line serves as an approximation to the curved line, with the landmark points serving to "mark" the continuous curve.
Figure 23 shows a representation of the letter "D" that involves the simple representation of a line for the vertical line component, and a more complex line segment to represent the curved component. Once the web file starts, select "D" from the "Which_shape" selection box at the bottom left.
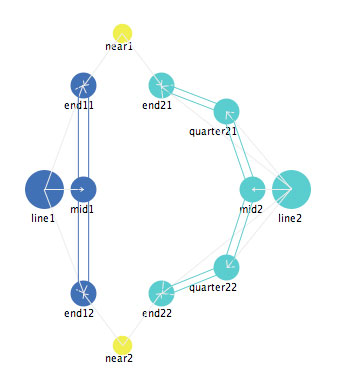
Figure 23: A representation of the letter "D" with a more complex
line segment approximating a curve.
We can use the same complex line to create a representation of the letter "B". One additional function for the invisible line is to keep the two loops of the "B" on the same side of the simple line, as shown in Figure 24. After the web file starts, select "B" from the "Which_shape" choices at the bottom left.
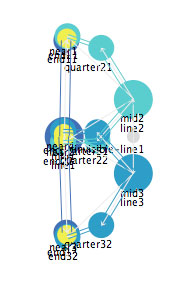
Figure 24: A representation of the letter "B", with an invisible
line keeping the loops on the same side.
This issue of "same side" vs. "opposite side" becomes clearer when we represent the letter "S" and the digit "3". Figure 25 shows a representation for the letter "S" and FIgure 26 shows a representation for the digiit "3".
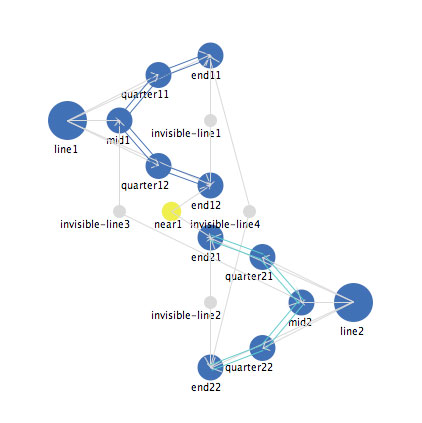
Figure 25: A representation of the letter "S"
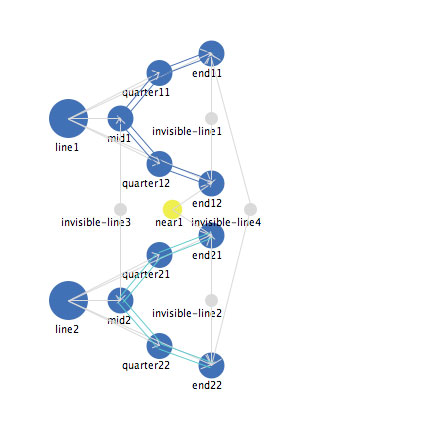
Figure 26: A representation of the digit "3".
Note that all of the structural elements of the two representations are identical. What then leads the representation for S to self-organize into an "S" while the representation for 3 self-organizes into a "3"? The difference is in the length of the invisible-line which connects the mid points of the two line segments. The length for "3" is shorter, pulling the two mid points closer and therefore on the same side while the length of the invisible-line connecting the two mid points is longer for "S", pushing them onto opposite sides. Here is an web file that allows you to vary the length of that invisible-line. When you view that web file, that you can see that shortening the apppriate invisible-line of an "S" makes it eventually "flip" over to a "3". Lengthening that invisible-line stretches the entire shape out into a straight line, which, when you then shorten the invisible-line, reorganizes into an "S.
With the components of a simple line, a more complex line, and an invisible line, and with the proximity mediator "near", we can represent the rest of the letters in the Roman alphabet and other simple shapes in the same self-repairing, self-organizing way.
More abstract mediators.
This framework of interactive mediators can be used in more abstract domains than purely spatial objects. Let us look at some simple examples in the abstract domain of numbers.
Numeric mediators. Mathematical functions such as "plus" or "times" are often thought of as little factories, with two numbers as inputs and one number as an output. So if you give 2 and 3 as inputs to "plus", you get out a "5". Let us instead view a mathematical function as an interactive mediator, operating on all of its immediate neighbors to maintain a specified relationship, where a change in any of the neighbors leads to changes in all the other neighbors. So, for the "plus" mediator, if the total increases, then the plus mediator will operate to increase each of the two addends. This is shown in Figure 25.
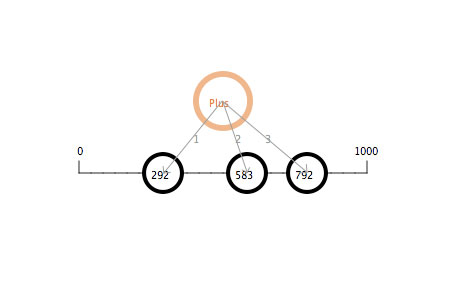
Figure 25: The operation of the "plus" numeric mediator.
Multiple compatible numeric mediators. Just as with the spatial mediators discussed previously, we can have multiple mediators operating on a set of concepts, each trying to modify its immediate neighbors to satisfy its defining relationship. Figure 26 shows two numeric mediators, "plus" and "equal".
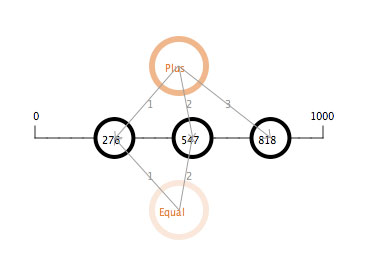
Figure 26: The operation of two compatible numeric mediators, plus and equal.
Because these two mediators are compatible, a stable state can be reached that satisfies both. In the case shown in figure 26, since the activity level of the "plus" mediator is higher than that of the "equal" mediator, the satisfaction of the "plus" mediator is reached sooner in time than that of the "equal" mediator, as shown in the graph to the lower left. In fact, the equal state was not quite reached when the screenshot for Figure 26 was taken, so N1 and N2 are still not quite equal.
Multiple non-compatible numeric mediators. As with the spatial mediators, multiple numeric mediators can be operating simultaneously on the same concepts in ways that do not necessarily lead to the satisfaction of all (or even any) of the mediators' goal relationships. Figure 27 shows the operation of two numeric mediators, "plus" and "times."
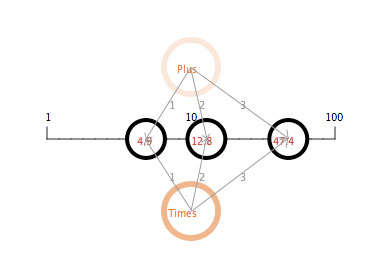
Figure 27: The operation of two non-compatible numeric mediators, plus and
times.
If the "plus" mediator has a higher activity level than the "times" mediator, then the relationship among the three numbers will be closer to an additive one; if the "times" mediator is more active, then the relationship will be closer to a multiplicative one. Except for the case in which all three numbers are zero, neither of these two relationships will be totally satisfied as long as the other mediator has a positive activity level. However, the representation will settle into a state where the more active mediator has more impact and the less active mediator has a smaller impact.
Key concepts.
There are several concepts that recur throughout the different domains that have been described in this paper.
Dynamic stability. One is the concept of dynamic stability. Under the impact of multiple simultaneous mediators, a stable state can occur that is the result of the dynamic operation of those multiple mediators. If any of the mediators change, then the stable state changes. One example of a dynamic stability is the property of the length of a line segment, which is the dynamic stability reach by the opposition of the two mediators of repulsion and attraction of landmark subparts of the line segment.
Self-repair. The representations illustrated
here are characterized by the property of "self-repair". That is, they have
a resistance to change, as the multiple simultaneous mediators operate to maintain
the overall structure of the representation. Local changes to components lead
to efforts to restore the overall structure, as each mediator operates on its
immediate neighbors to maintain its specified relationship. While the overall
structure is maintained, the disruptions to the structure often lead to changes
in other global properties. For example, the movement of a subpart of the spatial
representations of letters illustrated above lead to self-repair of the letter's
overall structure, but lead to translation and/or rotation of the letter. In
some cases, a change in a component can lead to a reorganization of the representation,
depending on the nature of the change. Thus the entities being represented
have an overall stability given changes in their environment, but can be modified
if certain kinds of changes occur. This gives them a dynamic stability in overall
structure.
Self-organization. Another property
of this landmark representation and interactive mediation framework is that
of self-organization. Given a random starting point for all the components,
the simultaneous operation of multiple mediators, each operating only on its
immediate neighbors, can lead to the creation of the overall structure of the
representation. This property addresses the issue of how new instances of any
representation are generated in the first place.
Multiple stable states and reorganization. Many of the representations have more than one stable state, and so some changes to a representation in one stable state will lead not to self-repair to that stable state but instead to reorganization into another stable state. Thus this framework captures the stability that is characteristic of many things, but also allows for change.
Future directions.
There are a number of different domains in which this framework shows promise in allowing us to characterize the highly interactive nature of the interaction that characterizes those domains. These areas of future development illustrate that the concepts presented here may have applicability to domains with much larger scales of analysis that the ones presented here.
Interactive mediation and discourse structure. One domain in which the landmark representation and interactive mediational framework seems to have promise is in the area of discourse analysis. Topic threads form the landmarks of discourse, with the continuous"flow" of discourse characterized by the creation of new topic threads which maintain their activity level for a time before fading while new landmark topic threads are created. The content of the topic threads mediates the creation of meaning among the participants in the discourse. The mediation provided by the variety of participant roles moves the discourse, sometimes in concert with each other, sometimes in conflict with each other.
Interactive mediation and classroom learning. Another domain for which this framework has promise is in analyzing the role that the variety of artifacts and mediators that are present in any classroom serve in the learning that occurs within the classroom. The variety of artifacts present in any classroom serve as landmarks for the interaction, and the variety of mediators self-organize the interactional structure that emerges to support learning among the participants in a classroom. The mediators in a classroom can be coordinated, operating to accomplish common goals; they can be uncoordinated, operating independently; or they can be discoordinated, operating in opposition to each other.
Interactive mediation and organizational reform. Educational institutions, like other large organizations, exhibit the dynamic stability property, reacting to reform efforts with the self-repair efforts characterized by the operation of multiple mediators, each operating on its immediate neighbors to maintain a specified relationship. Thus most reform efforts lead to small changes in the overall organization, which are "self-repaired" leading to a restoration of the overall structure of the organization with only small resulting global changes. However some reform efforts lead to a reorganization of the overall structure of the organization. The use of this framework may help to determine which reform efforts will lead to self-repair and which to reorganization, through the characterization of the landmarks and mediators that characterize the organization. The concept of mutual attraction can be applied as affiliation among different parts of an organization; the concept of mutual repulsion can be applied at this level as disaffection. Status and power operate as mediators to distribute impact among the components of the organization.
Summary.
These future directions point to the possibilities that the landmark representation and interactive mediation framework presented here may be applicable to a variety of domains, with a range of scales of analysis. By using more dynamic media to express our theories and models, we may be able to better capture the dynamic properties of systems that have proven difficult to represent in more static media like print on paper.
References.
Levin, J. A. (1973). Network representation and rotation of letters. Unpublished paper. La Jolla, CA: Department of Psychology, University of California, San Diego. [Online at http://pages.ucsd.edu/~jalevin/levin73.pdf ]
Palmer, S. E. (1999). Vision science: Photons to phenomenology. Cambridge, MA: The MIT Press.
Rosch, E. (1973). Natural categories. Cognitive Psychology, 4, 328-350.
Siegler, R. S., & Opfer, J. E. (2003). The development of numerical estimation: Evidence for multiple representations of numerical quantity. Psychological Science, 14(3), 237-243.
Wilensky, U. (1999). NetLogo. http://ccl.northwestern.edu/netlogo. Evanston, IL: Center for Connected Learning and Computer-Based Modeling, Northwestern University.
Concepts: Their activity, their actions, their interactions, and their mediation of interaction.
Let us start with the idea of a concept as the basic unit of representation. A concept is represented as a "node", interconnected with other concepts. Another key property of a concept is its activity level. A concept can have a zero activity level (that is, it can be totally inactive), it can have a high activity level, or it can have any level of activity in between. Figure A1 shows a concept with zero activity level and the same concept with a high activity level.
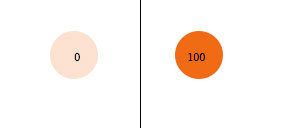
Figure A1: A concept with zero activity level (left) and a concept with a high activity level (right).
Figure A2 shows a NetLogo web file that allows you to change the activity level of a single concept. NetLogo (Wilensky, 1999) is a powerful multi-agent simulation system that is multi-platform and freely available and allows simulations to be saved as HTML5 web files that can be accessed via the Web. Click on Figure A2 to run the web file.
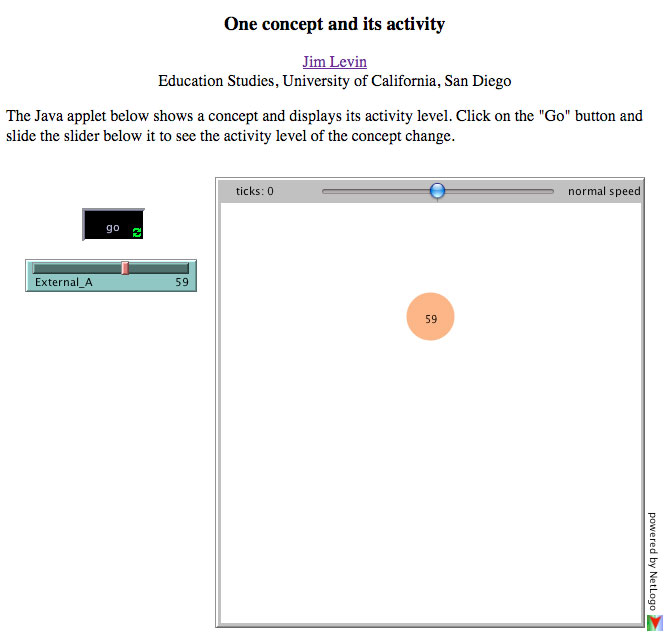
Figure A2: A NetLogo web file that shows the activity level of a single concept.
What does the activity level of a concept mean? The general idea is that the higher the activity level a concept has, the more impact it has on neighboring concepts. What does "impact" mean? Let us look at some simple kinds of impact that one concept can have on another.
Action of one concept on a second concept.
If we have two concepts, there are three ways that the first concept can impact the activity level of a second concept: 1) the first concept can increase the activity level of the second concept, 2) the first concept can decrease the activity level of the second concept, or 3) the first concept can have no impact on the activity level of the second concept. These three possibilities are illustrated in Figure A3. The action of the first concept to increase the activity level of the second is illustrated by an "excitatory" arrow from the first concept to the second, shown on the left of Figure A3. The action of the first concept to decrease the activity level of the second is shown by the "inhibitory" link (a line with a end-cap), in the center of Figure A3. The (non)action of the first concept having no impact on the activity level of the second is shown on the right of Figure A3, with the two concepts shown with no interconnection.
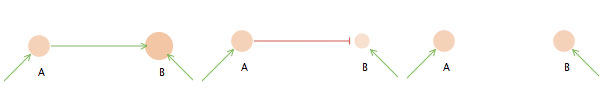
Figure A3: Three possible actions of one concept on the activity level of a second concept: excite, inhibit, none.
The three possible actions are shown more dynamically by an web file, shown in Figure A4. To interact with this web file, click on Figure A4.
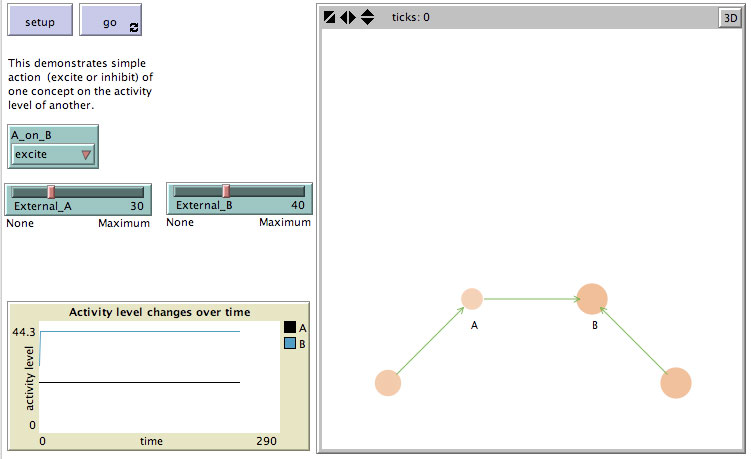
Figure A4: An web file that shows the impact of one concept on the activity level of a second concept.
If there is an excitatory link between one concept and another, then the activity level of the second concept increases when the activity level of the first concept increases. If there is an inhibitory link between one concept and another, then the activity level of the second concept decreases when the activity level of the first concept increases. If there is no link, then the activity level of the second concept is not directly changed when the activity level of the first concept changes.
Interaction of two concepts.
With two concepts, there can be not only just the action of one concept on a second, but also the simultaneous action of the second on the first. Since there are three possible ways for the second concept to act on the first for each of the three ways we've just seen for the first to act on the second, there are nine possible interaction cases, as shown in Table A1.
| Action of A on B | ||||
Excite
|
Inhibit
|
None
|
||
| Action of B on A |
||||
None
|
A -> B
|
A -| B
|
A B
|
|
Inhibit
|
A |-> B
|
A |-| B
|
A |- B
|
|
Excite
|
A <-> B
|
A <-| B
|
A <- B
|
|
The nine possible interactions are shown more dynamically by a NetLogo web file, shown in Figure A5. To interact with this web file, click on Figure A5.
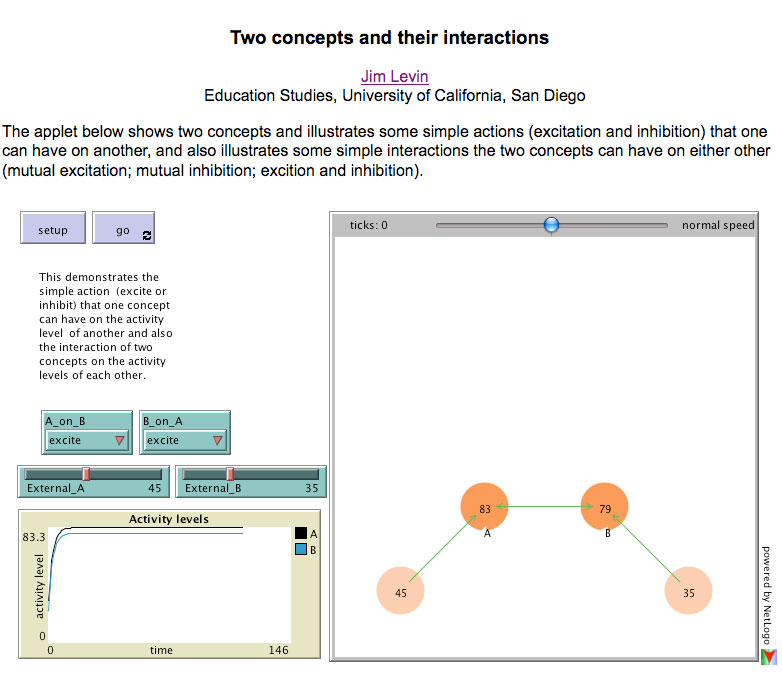
Figure A5: An web file that shows the interaction of two concepts with each other
.
Of these nine interaction types, we have already seen five of them previously: A -> B; A -| B; A B, and the two reverse cases: A <- B and A |- B which are equivalent to the forward cases. This leaves three new mutual interaction patterns, shown in Figure A6: 1) mutual excitation A <-> B; 2) mutual inhibition A |-| B; and 3) excitation-inhibition A |-> B and the equivalent reverse case of A <-| B.
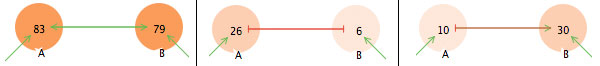
Figure A6: Three interaction patterns: mutual excitation, mutual inhibition, excitation-inhibition.
Mutual excitation: At first glance, it looks like mutual excitation would cause an explosive positive feedback condition in which the activity levels of both concepts would go to their maximum values. But in fact this interaction pattern stabilizes fairly quickly, with the activity levels of both concepts increased. An interesting effect of this interaction is that initial differences in activity levels between the two concepts are systematically reduced. In figure A5, you can see that there is a difference of 4 units of activity level between A and B. With no interaction, the difference is 7, as shown in figure A7.
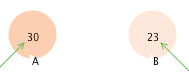
Figure A7: Activity levels of concepts A & B with no interaction.
So, overall the impact of mutual excitation is to increase the activity levels of the participating concepts, but to smooth out differences in activity levels.
Mutual inhibition: You might imagine at first glance that the impact of mutual inhibition would be to drive the activity levels of both concepts to zero. However, again, like mutual excitation, this interaction pattern stabilizes fairly quickly, with the activity levels of both concepts reduced but in many cases to a non-zero level. While mutual excitation reduces differences, mutual inhibition increases differences. With the same input conditions as shown in figure A7 which produce a difference of 7 in activity levels, mutual inhibition (as shown in the middle of Figure A6, produces a difference in activity levels of 20 units. So the overall impact is to decrease the activity levels of the participating concepts, but to amplify differences in activity levels.
Excitation-Inhibition: The third pattern is the asymmetrical interaction where one concept excites the other, but the other inhibits the first. As a pair-wise interaction, this also stabilizes fairly quickly. As far as properties of this interaction pattern, we will revisit this pattern below in the discussion of mediation among three concepts.
Mediation among three concepts
Next let us consider the possible interaction patterns if we have three concepts. Figure A8 shows an web file that allows you to explore these possibilities.
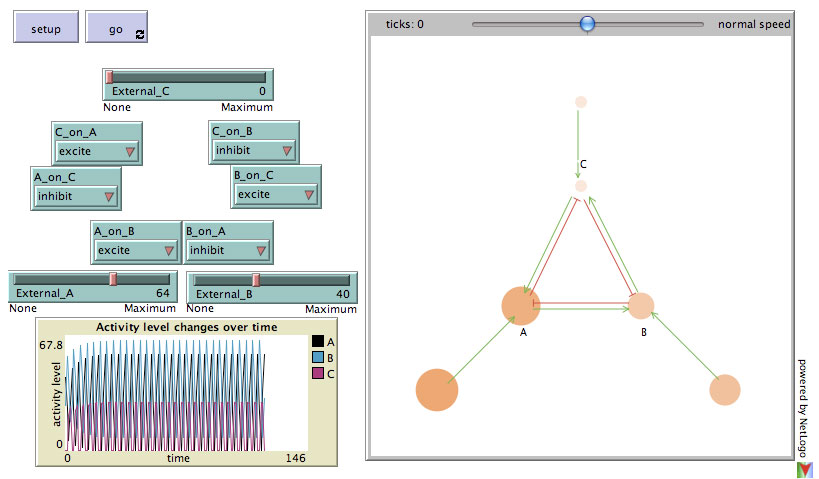
Figure A8: An web file that allows exploration of interaction among three concepts.
In the example shown in Figure A8, if we have a set three concepts interconnected with the "excite-inhibit" interaction pattern, we get an oscillating dynamic equilibrium, in which each concept's activity level increases and decreases out of phase with the increases and decreases of the other two concepts. So while two concepts interconnected with this interaction pattern reaches a stable state, the mediation of a third concept, even when it has no external activation, creates a dynamic oscillation. This is an example of the power of mediation in this simplified world.
In this case, we're considering concept C as mediating between concepts A and B. But the situation is symmetrical - we could just as well consider concept A as mediating between concept B and concept C, or concept B as mediating between concept A and concept C. In fact, each is mediating between the other two at the same time as the others are also mediating. This idea of multiple simultaneous mediators will recur elsewhere in this paper.
Mediation among four concepts
Mutual inhibition amplifies differences between concepts, as shown in Figure A6. If we add "context" to those two concepts, then the ampification takes on a "step-function" character, where the domination of one concept is sudden and somewhat persistant. Figure A9 shows the state right after the transition has occurred.
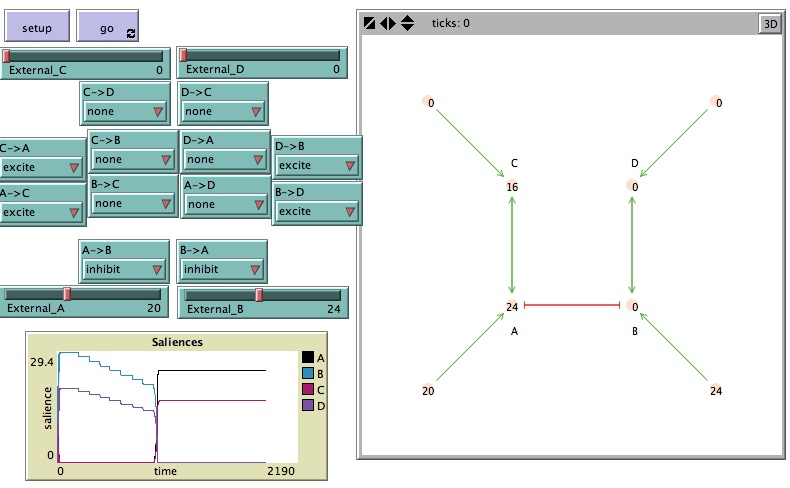
Figure A9: An web file that allows exploration of interaction among four concepts.
The "saliences" graph shows the gradual decrease in the activity levels of concepts B and D as the external activity input to B is decreased from 24 to 17, and the sudden decrease in the activity levels to zero when the input is decreased from 17 to 16, as the four concepts "flip" from one state to the other. The same graph shows that increasing the external activity from 16 back up to 24 doesn't change the activity levels. However, an increase from 24 to 25 will "flip" the system back to the original state. In this sense, this system of four concepts exhibits a "memory" effect, such that a change in the external conditions cause a change that remains when the external conditions return to their original state.