Content created: 2010-09-09
File last modified:

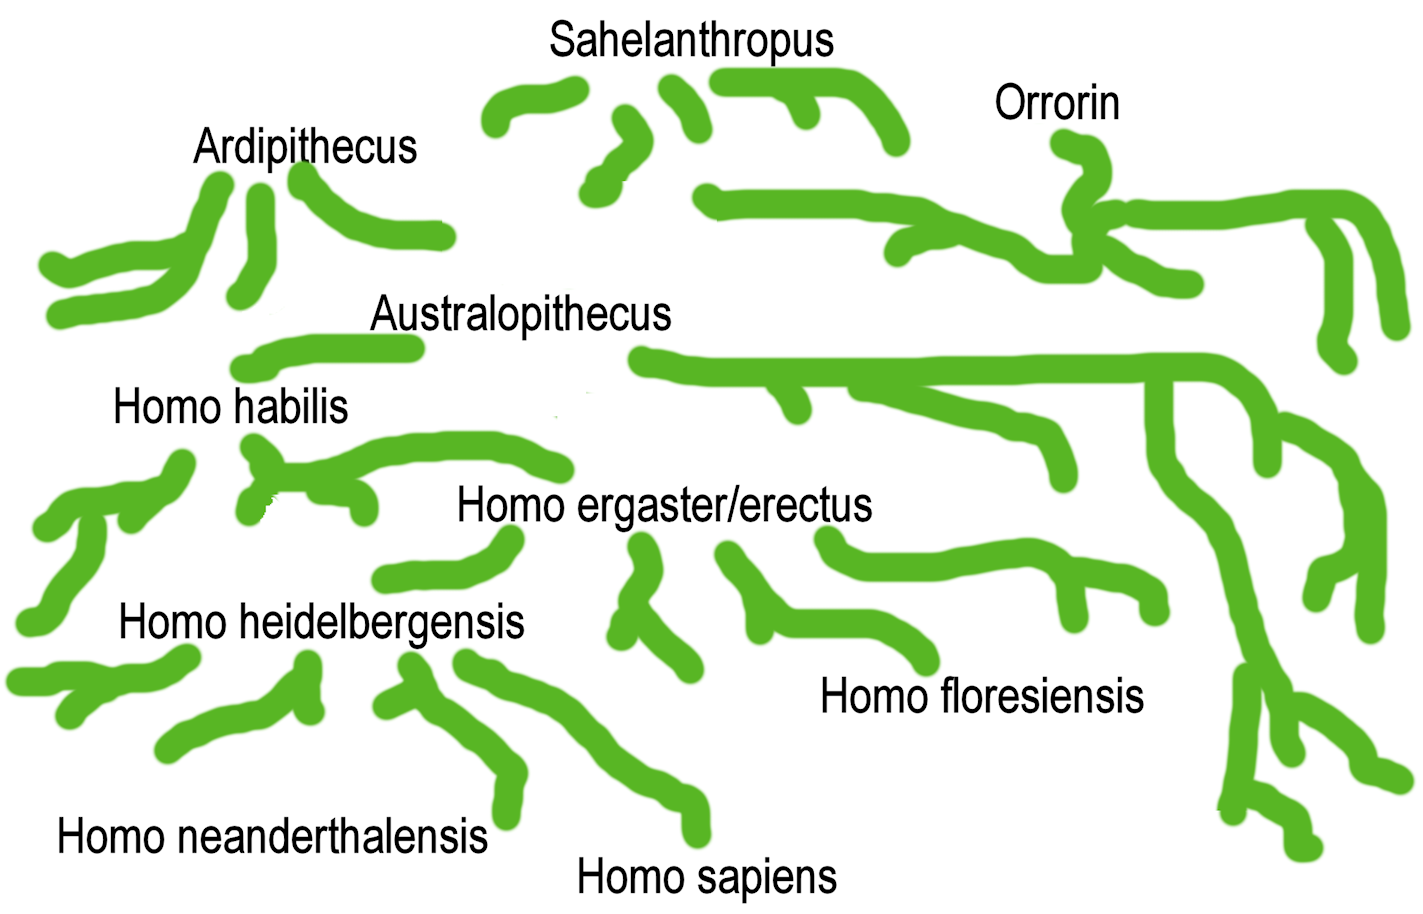
It is very unlikely that any fossil specimen will ever be found that is actually ancestral to any living human. The best we can do is to estimate the way in which the various fossil hominids that come to our attention possibly could be related to each other or to us. Whatever the ancestor of Homo erectus was like, it was probably something like Homo habilis, for example.
To convey that uncertainty, this chart never actually connects any form definitively with any other. And to suggest the complexity of the problem, this chart includes lots of descent lines that don't go anywhere. (There would have been millions more.)
Taking note of all that, what would be the "most probable" line of descent among these forms? Little can be said about the earliest forms. It seems likely at the moment that a line probably runs from some kind of Australopithecus through Homo habilis, H. ergaster/erectus, H. heidelbergensis, to H. sapiens.
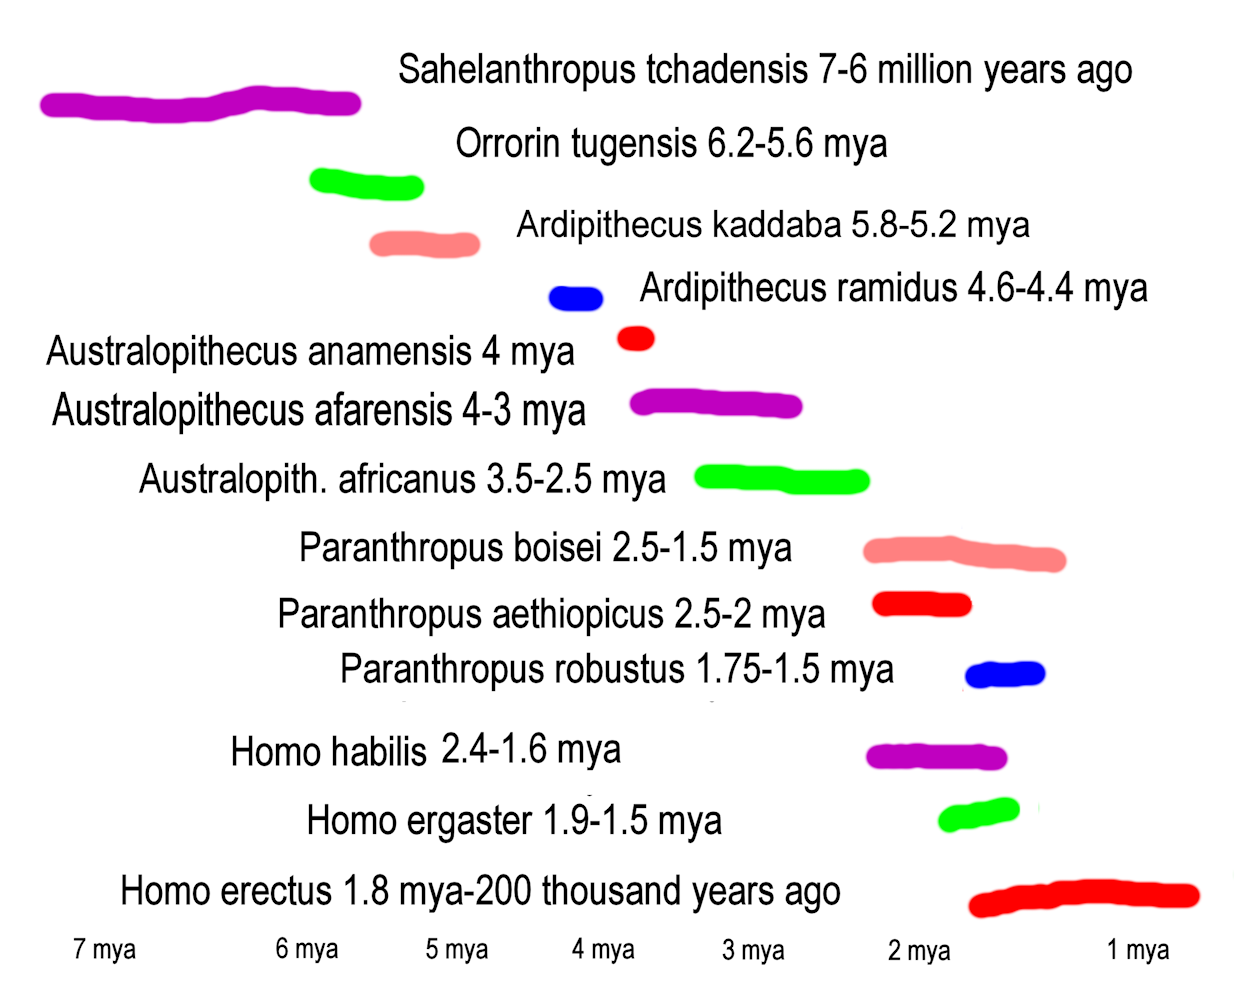
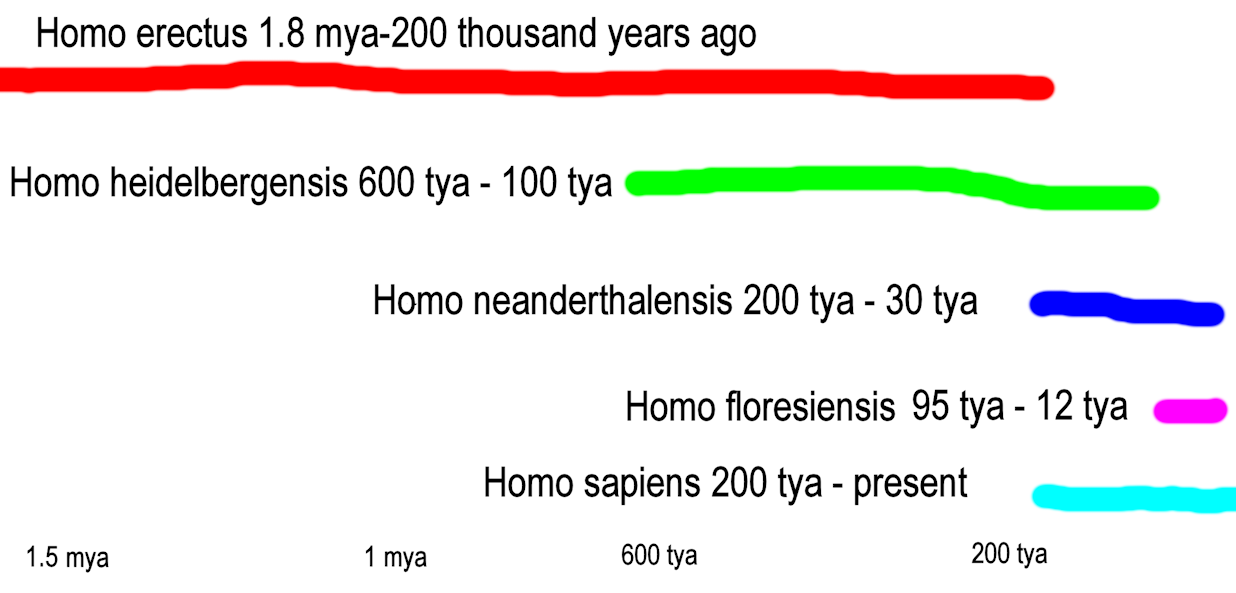
This section contains two charts at two different scales intended to provide a visual indication of the approximate span of time over which the species mentioned on these pages may have lived.
In some cases the colored line merely represents the range of dates across which different evidence suggests that a one or a few specimens may turn out to be dated. For example, a date range from 5 mya to 6 mya may mean that there are several specimens securely dated across that range, or that there is a single specimen belived to fall somewhere within that range.

