
It can be frustrating (and/or alarming) to go to the beach to see the seals and
find only empty sand. Where did they go? Have they abandoned Children's
Pool? Left La Jolla? Been chased off? One hears such questions regularly.
Truth is, nobody really knows where they go when they leave the
beach and Seal Rock area; "out to feed" presumably covers many absences,
but is not the whole story. What we do know is that there is nothing
unusual about coming and going at a seal haulout.
First off, the seals are still around (we'll try to update this page frequently, so
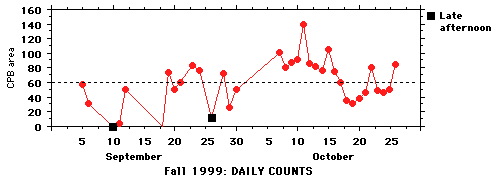
that "still" always will be current). Here are counts for Fall
1999:
With few exceptions, these counts were made before 8:00am, and often there
are 50+ seals on the beach before 8:00am and none by 9:00.
The overall average is indicated by the dashed line. The seals seem
to be early risers and hit the surf soon after sunrise. Click
for updates.
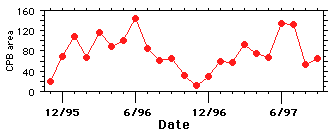
Part of the variation is seasonal, as shown here:
As you can see, counts at the Children's Pool beach tend to be high during the
winter and fall during the summer, reaching a low in October/November
before climbing again. One possibility is that the warm, sheltered
beach is just a little too warm for the seals during the summer. This
certainly fits with the daily pattern, above.
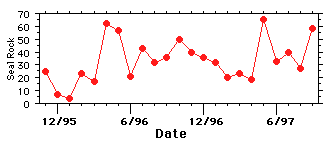
Interestingly, counts from nearby Seal Rock show less variation:
This is at least consistent with the idea that it sometimes gets too hot on the
sand for the seals to be comfortable. Many of us have both AC and heat in
our homes; seals have to find comfortable temperatures some other way. For
more on how seals use haulouts to regulate temperature (and so their
metabolism, and whole energy budget), click
here.
These counts come from ongoing research by UCSD students. Seals are
counted at least twice, with additional counts as needed to resolve
discrepancies; whenever possible two observers do independent counts to
ensure accuracy.

(morning counts, LJFS; click for methods)
(monthly maximum counts, from Yochem & Stewart, 1998)
(monthly maximum counts, from
Yochem & Stewart, 1998)
                   # of seals
date     time   on sand/wall rock/   total #
         (AM)     submarine rock     seals

10/7       7:00       100/1/0       101

10/8       7:00        81/0/0        81
           7:15        73/0/0        73
           7:30        71/0/0        71

10/9       7:10        85/2/0        87

10/10      6:30        86/3/2        91
           6:45        86/3/2        91
           7:15        66/3/2        71

10/11      7:15       136/3/0       139
           9:15        15/0/0        15

10/12      7:15        82/3/1        86

10/13      7:15        78/3/1        82

10/14      7:15        76/0/0        76

10/15      7:18       100/5/0       105
           9:00        97/5/0       102

10/16      7:15        72/3/0        75

10/17      7:15        56/1/3        60

10/18      7:19        35/0/1        36
           8:14        19/0/1        20

10/19      6:45        27/2/2        31
           7:20        25/0/0        25
           8:20        18/0/6        24

10/20      7:15        32/1/5        38
           8:00        32/0/8        40

10/21      7:19        46/0/0        46

10/22      7:19        81/0/0        81

10/23      7:12        49/0/0        49

10/24      7:15        45/1/0        46

10/25      7:15        48/1/1        50
           8:00        39/1/0        40

10/26      7:30        84/1/0        85
           8:00        63/1/0        64

10/27      7:17       127/3/2       132

10/28      7:15       100/4/2       106

10/29      7:15        82/0/0        82

10/30      7:00       111/1/1       113
           7:20       114/2/2       118

10/31      6:50        72/2/1        75
           7:15        61/1/1        63

11/1       6:30        62/3/0        65
           7:30        49/0/0        49
           7:45        48/0/2        50
           8:00        40/0/2        42

11/2       6:30        62/0/0        62
            7:15       40/0/0        40

11/3       6:30        56/1/0        57
           7:15        49/0/0        49
           8:00        49/0/0        49
Back to top of page