Cogsci 109 Assignment 4
Due: Tues Nov 12, 2013 10:59AM
For this homework, you will want to look at the example code on the
course website (linregress.m, predyval.m, linregresslargerexample.m,
leaveoutcode.m, myfitdemo.m, myfitfun.m)
1. Linear Regression
For this question you will use the data files:
xdata
ydata
xdata holds the x-coordinates of a set of data and ydata holds
the corresponding y-coordinates. You might want to look at the matlab command : load
and hold on
.
Put the following code in a script file called regression.m
a) write the code to plot the 2-dimensional data as green stars. (use load and plot commands)
b) write the code to fit the best (in the least squares sense) linear
fit to the data. (use the \ command)
c) write the code to draw this on the graph of the data as a red line. (keep the green stars showing)
(Use the hold on and plot commands)
d) write the code to fit the best (in the least squares sense) quadratic
(second order) fit to the data.
e) write the code to draw this on the graph of the data as a blue line.
(keep the red line and the green stars as well.)
f) write the code to fit the best fifth order fit to the data and draw
this on the graph of the data as a black curve (again keep the
previous curves and the data). Store this final figure (with green stars and red/blue and black lines/curves) as hw4q1.jpg.
g) Which of the three line/curves looks
like a better fit to you? Put this as a comment in the code "I think
that the _________ (fill in linear, quadratic or fifth-order) model is
a better fit to the data."
2. Overfitting Calculation
This question builds on the one above and uses the same data.
In this question we will try to find an answer to the question
"Is the data better fit by a 2nd order fit or a 5th order fit"
You may use the code in
hw4q2.m
You will need to write the code for the function
predictyval.m that takes as input two variables, xleftout
, the x value that you want a predicted y value for and parameter vector
(e.g. mnpqrb from lecture) that supplies the parameters of the fit.
The function must output the predicted y value at x value, xleftout.
Note you can do this with one function predictyval.m to handle
both the quadratic and fifth order fit, but if you prefer you can write
two separate functions.
Which fit gives a lower root mean square "leave one out error"?
Make sure that the numbers agree with your intuition from the graphs.
Put this in a comment in your code predyval.m with the following
words (with the blanks filled in with either "The quadratic fit" or
"The fifth order fit"
_______ Gives a lower root mean
square leave-one-out error. Therefore I think that ____________ will
generalize better to unseen data from the same distribution.
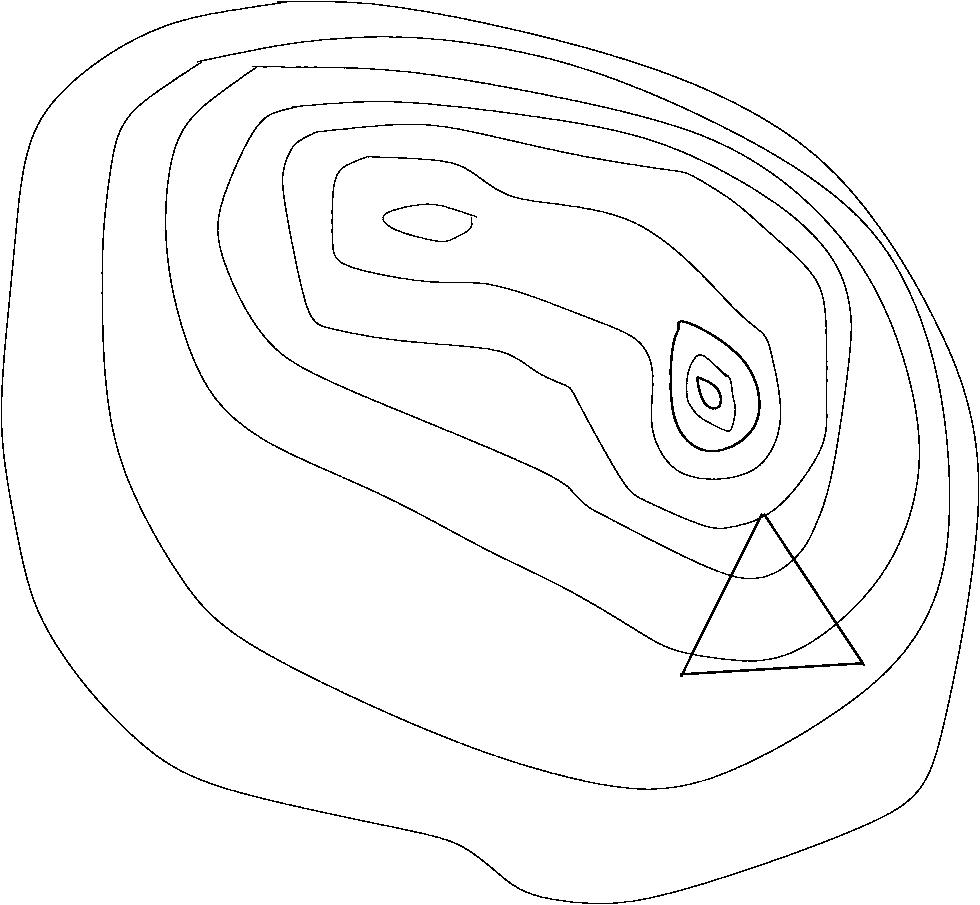
3. Nelder Mead algorithm written homework -- Please bring this to class with you on Nov 12
Consider the contour plot below (where contours are drawn at even
spacing of the Error function). Assume that the contour plot is a
good representative of the error surface (that the surface varies
smoothly between the contours) and that the highest contour is the
outside one.
a) Draw the next position of the simplex after one step of
the Nelder-Mead algorithm (assume an alpha of 1).
b) If the new point had been the new best point, how would the simplex change?
c) If the new point had been worse than the remaining two, how would the
simplex change?
4. Function fitting with non-linear parameters in MATLAB
In this program you will use Matlab's fminsearch routine to fit
the function y=ax + bsin(cx) + d to the data above (xdata,ydata). Note
for full credit, you must do this the efficient way where you only use
the Nelder-Mead algorithm to search for the one non-linear parameter (as
in the
myfitdemo/myfitfun example in the class notes NOT as in the
myfitdemoslow.m/myfitfunslow.m)
You will use the programs
hw4fitdemo.m
and
hw4fitfun.m
but you will have to add lines to hw4fitfun.m to do all the work.
Save the figure of the final fit in hw4q4.jpg
5. Checking Generalization
You will now do the same leave-one-out computations you did in
question 2 above to estimate the future error rate with this type of
model fit to the data.
You will use the program
hw4q5.m
You will need to add two lines (indicated in the code)
%%%%%%%% write next line to compute yp
%%%%%%%%% write next line to compute yleftout (you can write it in one
%%%%%%%%% line of code (you don't need to write a predictyval function
You will also need to comment out the incremental plotting parts in
hw4fitfun.m
(as mentioned in that file)
Save your figure of the overlaid different fits (for leaving different points out) as hw4q5.jpg.
How does this model (y=ax + bsin(cx)+d) compare to the polynomial models from
Question 2? Write your answer in a comment in your hw4q5.m code.
6. K-means written homework -- Please bring this to class with you on Nov 12
Consider the example below. Cluster centers (or means) are depicted as X's, data points are dots. The box on the top (with 1 in the corner) represents a
system with 8 data points and K=2 cluster centers. To help you answer the question, the dividing line midway between the two centers is shown by a dashed line.
a) In the box in the center (with 2 in the right corner), draw the next position of the means (in the next iteration) and
b) in the box on the bottom (with 3 in the corner), draw the next position after that (in the next iteration) of the means.
You may want to continue drawing dashed lines to keep track of how the space is being divided (and show us your work).
Initial State
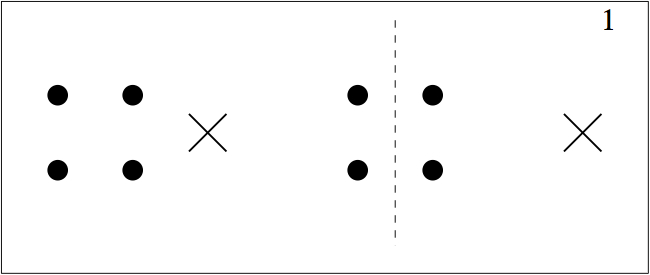
b)

c)
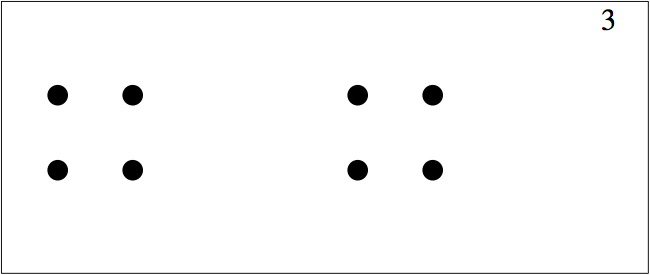
c) In general (not just for the example above) when will the K-means algorithm stop? (what condition must be fulfilled? - be as specific as you can). You do not have to write it as an equation but you may.
What to Hand In
Hand in your script files regression.m, predictyval.m, hw4q2.m (which
you may have modified) hw4fitdemo.m, hw4fitfun.m, hw4q5.m as well as
hw4q1.jpg, hw4q4.jpg, hw4q5.jpg on TED .
Hand in your written homework at the start of class Tuesday, November 12th.