ALLOMETRY
Jim Moore, Anthropology, UCSD
In the unlikely event that
you're another
teacher and would like to use this, please -- be my
guest!
Nov. 2002: Tired of reading about allometry in English? Thanks to Jean Lobry (Univ. C. Bernard - LYON I) there is now a PDF handout on allometry in French, available at http://pbil.univ-lyon1.fr/R/pdf/tdr333.pdf
This handout describes the application of allometric analyses to some
primate problems. The
approach is extremely powerful and is central to understanding comparative
studies; at first it may
seem overwhelming but a few examples should help straighten it out.
Because of the [possible] tie-in
between brain size, complex primate behavior, and human evolution, the
examples all come from
analyses of relative brain size--but the basic approach can be applied to any
comparison of a
morphological feature across individuals/populations/species etc.
Most biological functions increase as some power of body size. For
example, more energy is
needed to "run" an elephant than to run a mouse; as body size increases, so
does the energy needed by the
organism. More cognitively, if bodies are operated by brains, then it seems
reasonable that the larger
the body, the larger the brain needed to operate it--more nerves needed to
coordinate more muscles,
etc. However, such size-based relationships are rarely 1:1 (that is, it is rare to
have a 1-unit
increase in body size produce exactly a 1-unit increase in metabolic rate, or
brain size, or whatever).
So, we are interested in the relationship between body size and brain
size; we expect larger
animals to have larger brains, but we want to know more about the
relationship for TWO
REASONS:
-
First, knowing something about the general relationship might tell us
something interesting about brains and cognition and intelligence in
general.
Second, if there is a general relationship, then we want to factor it
out when talking about brain size in relation to cognition: cows have bigger
brains than most monkeys, but that probably has more to do with having
really
bigger bodies than with unsuspected cow intelligence.
For starters, it makes sense to go out & measure a bunch of primates' body
and brain sizes:
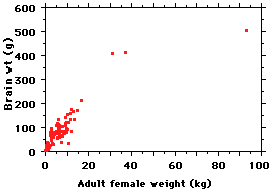 Here is a plot of the data for 117 species;
adult females were used because it
simplifies how one deals with sexual
dimorphism, and for various theoretical
reasons female mammals are thought to be
the "ecological sex", with males more a
derived form of females (driven by sexual
selection). Here is what the data look like;
note that body weight is given in kilos
(1,000 gm) - so multiply the body
weights by 1,000 to get them into the same
units as brain weights.
Sure enough, bigger-bodied species
tend to have bigger brains (wow). But how
do we express that relationship?
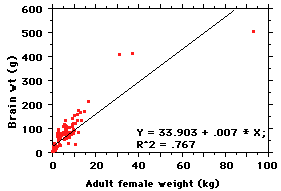 Well, why not do a regression of
brain size on body size? There are several
methods for calculating a regression (see
below), but the principle is simple: it is a
line of best fit between the
variables. And the line itself can be
described by a simple equation of the form
y = mx +
b
where y =
predicted brain weight, x =
observed body weight, m = slope
and b = the
value of y where the line intercepts the
vertical axis. The regression here explains
about 77% of the variance (R^2) --
that is, about 77% of variation in y is
explained by variation in x. But
there are
some problems... Looking at the line,
it is clear that while it might be the
best average straight line fitting
those points, there is a strong
tendency for points near the ends to
fall below the line and points in the
middle to fall above it. Basically, the
relationship between body weight and
brain weight does not seem to be
linear. Pity... so now what? 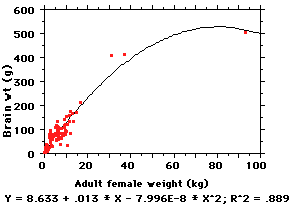
Try a nonlinear regression, of
course. Here is a "2nd-order"
regression (note the new
x2 term in the equation)
and you can see that now the line
explains about 89% of the variation
-- which is pretty good.
HOWEVER, 2nd-order equations are cumbersome and difficult to
compare (say we wanted to
know if the relationship between body size and brain size was the same in
primates and cetaceans [Y =
-6.162 + 2.834 * X - .202 * X2; R2 = .922 for a sample
of 21 whales and
dolphins] -- now what? Two horrendous equations...). Also, most of the 114
non-ape species are still
packed into the dense cloud of points at the left; basically, most primates
weigh between 1,000-
15,000 gms (1-15 Kg) and one can't get a visual feel for variation amongst
them. It is hard to do
much with such a figure and equation.
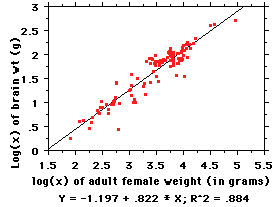 So we convert the raw data to base-10 logs,
as in the figure at left (note units need to
be the same, so body weight is now in
grams). As you can see, when the
data are expressed as logs, they fit a nice
easy linear equation, the points are spread
out so we can see what is going on, and the
R2 value is essentially
unchanged (the slight difference between
0.889 in the untransformed data and the
0.884 here is due to the transformation; don't worry about it, it is small).
Now: the equation for the line here is of the familiar "y=mx + b"
form, but the "y" and "x" here are actually
log(brain weight) and log(body weight)
This is an allometric equation;"allo" comes
from Greek allos =
"other", in this case "other than metric" -- that is, nonlinear
(the alternative is a linear or isometric
equation, a 1:1
relationship -- e.g., for every kilo of body weight, add 20gm of brain). We
merely made it linear by
the log transformation in order to visualize it better and to be able to work
with it more easily.
To express the same nonlinear relationship directly -- that is, with an
equation in which x is body weight, not log(body weight)-- we convert from the
above which is really
log(y) = log(b) + m[log(x)]
to the standard form for allometric equations, y =
bxm
EXAMPLE: how large do we expect the brain of a 1,000 gram (1kg)
female monkey to be,
based on the above regression?
-
1) in y=mx + b form (as shown in the graph above), y = -1.197 +
0.822
This is the empirically derived equation for the regression of
brain size on body size in the sample above, and so is our best tool for this
prediction.
-
(...well, what is the log of 1,000?)
Log(1,000) = 3 (recall: 1,000 = 103) so log(y) = -1.197 +
0.822 * 3
-
-
= 1.269
y = 101.269 = 18.6 gm
2) or using y = bxm, after converting "b" from
log:
10-1.197 = 0.064:
-
y = 0.064 *
1,0000.822
= 18.7 g
(18.6 and 18.7 are within rounding error). So that's how we can convert
between the two
forms of the equation (with one minor but annoying caveat: we all learned
the equation for a line as
y=mx + b, where b = intercept and m = slope. I kept the
m=slope
in the above so you could see the relationship between the two forms of the
equation, but for some
reason having to do with perversity of mathematicians, the allometric
equation's general form is
usually written as y=bxa where b is called the
"allometric
coefficient" and the slope is designated by an a, not m. Oh well,
could be worse.
One last bit of mathematical fun
before getting back to (more or less)
biology: there are actually several
different ways to compute the line
of best fit. Researchers get into
endless arcane arguments about which
method is better for which sort of
analysis; the preferred methods seem to
be major axis or reduced major
axis analysis.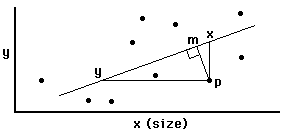
-
Regression: minimizes line X-P
Major axis (=principle components) analysis: minimizes line
M-P
Reduced major axis analysis: minimizes area of triangle Y-X-P
TO RECAP:
The general form of the allometric equation is y
=
bxa where y =
measure/process in question, x is size
(usually weight),
a is the allometric exponent (which
tells you the
relationship between x & y), and b = a
constant (the
allometric coefficient). For example, among mammals the basal metabolic
rate (BMR, measured in
Kcal/hour) = 3.8(weight)0.75
The Important Thing To Realize is that
in this equation (and other allometric equations), the 3.8 and the 0.75 are
empirically derived.
You weigh a whole lot of animals, measure their BMRs, graph the results on a
log-log plot, and discover
that the regression line has slope 0.75 and intercepts the y-axis at 3.8.
Obviously, it makes a
difference which species you look at. Different taxa have different values for
b, and the value of the exponent can depend on
what you're studying
(BMR, here). This means that you can find different values reported for, say,
the slope of the line
relating brain size to body size--it depends on the sample.
AAARRRGHHH! Why do we CARE? I mean, we go through all this
math, and at the end
discover it is a lot of work that yields a precise answer, but different answer
depending on the sample
used; what is the point? What does the slope TELL us that we didn't already
know???
It so happens that basal metabolic rate (BMR) increases as a ca.
0.75 power of weight--a baboon needs absolutely
more energy than a marmoset, but a good bit less per gram (why it is 0.75, who knows--
it is an
empirical finding). On the other hand, for purely geometric reasons, the
surface area of same-shape
solids increases as a 0.67 power of volume
(which is about the same as
weight, as long as we stick with animals). If relative brain size is related to
body surface area (logical
enough; our skin is a neurological interface, after all), then brain size should
scale to ca. 0.67 power of
body weight; if BMR is the critical factor* then the power function should be
close to 0.75. Hence
the interest in working out the slope--it can tell us what is biologically
important.
-
* Reasonable; high metabolism, more energy needed to fuel
the system, and more energy available for doing complex
things -- like look for the source of that energy!
Now let's get into application of the method to the
problem of
intelligence and brains:
1) What might the slope tell us?
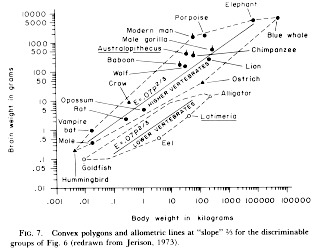 One
of the first and most widely cited allometric
analyses is Jerison's work on relative brain size
in vertebrates. In the figure at left (from Jerison 1983), you can trace
the two lines backward to see that they in fact
intercept the Y-axis at 0.07 and 0.007, as
SHOULD be indicated by the allometric
coefficients in the equations (the lower 0.07
is a typo that does not appear in the original 1973
paper; it pays to read critically!). The ten-fold
difference in intercept supposedly reflects a
difference in grade; the "lower" vertebrates doing
something fundamentally different from the
"higher" vertebrates in terms of brain/body
allocation. However, the slopes shown are equal
(allometric exponent = 2/3, or 0.667),
indicating that within each grade, the same set of
rules apply to how the brain is scaled with respect to body size. Since 0.67 is
the exponent for surface
area:volume relationships in solids, and there is a plausible argument for
surface area being
functionally related to the nervous system's basic requirements, this suggests
that relative brain size
in vertebrates is "driven" by body surface area (rather than being, say, a
simple isometric
relationship), with "higher" vertebrates applying the same relationship but
"scaled up" to reflect
overall greater emphasis on intelligence.
Cool, except Jerison cheated. Well, fudged. As he explains in his papers
(the figure here is
from 1983), the lines shown are actually not regression (or major axis or
whatever) lines at all; they
are lines of slope 0.67 that he fitted by eye to the data points, because
he thought surface area
was the key and the lines look pretty close. This is not the way to do science
(in his defense, he was the
first to really even think of this sort of problem, and pioneered the field;
pioneers often get the big
picture right but goof on the details; besides, he did use quotes around the word "slope" in the caption). Most subsequent analyses of large
numbers of mammals have
found slopes much closer to 0.75, favoring an underlying BMR basis to brain
size; however there are
these interesting deviations (remember, for 117 primates we got 0.882, and
for the smaller cetacean
sample, slope is 0.376 [but restrict it to dolphins, and it's 0.682; for 139
primates and
cetaceans combined, the slope is... 0.673!]). There are many papers and
several books written just on
the subject of allometry; let's leave it that the meanings of slopes in
brain:body analyses are still being
investigated. In general,
-
1) for large samples the slope tends toward 0.75 suggesting something
metabolic is involved;
and
2) as one narrows the taxonomic unit of analysis (from mammals to Family to
Species, say) the
slope tends to decrease, to the point that within species the brain:body slope
is close to 0
-- body size explains very little of the variation observed in brain size
within
species.
2) What might scatter around the line tell us?
The overall relationship between body size and brain size, as reflected
by the slope (allometric
coefficient), might tell us something about the fundamental nature of
determinants of brain size in
broad taxonomic groups. However, we are also interested in species (or
genera, etc): e.g., are gorillas
large-brained for their size? Underlying this is obviously the question, "are
they 'smart'?"; there are
lots of problems using brain size as an indicator of intelligence and here we
are addressing only how the
method works, not whether it should be used). Underlying this is the
intuition that absolute brain size
is not a good indicator of intelligence; if it were, blue whales would be
the smartest animals on
earth--something for which there is zero behavioral evidence. Rather, we'd
like to "factor out" that
portion of brain size that is "due to" body size, leaving behind relative
brain size.
Clearly, since the line of best fit (regression, major axis, or reduced
major axis) is calculated
based on the data, it should be possible to calculate exactly how far each point
is from the line; it is, and
these numbers are called residuals. One can then use these residuals
in one way or another to
calculate an index of brain size relative to what is predicted for an animal of
that body size. Different
researchers use different indices (two you might run into are "comparative
brain size" or CBS, and
"encephalization quotient" or EQ). Animals with large EQs are thought to be
relatively "smart" and
those with small EQs are... not (for example, the siamang in the figure below).
CAUTION: There
are 3 possible lines of best fit, and since this is empirical of course the exact
line--and hence
residuals--will depend on which species are in the sample, AND there are
different ways to calculate
the EQ (should you base the human EQ on all mammals, on just "primitive"
mammals (compare to a
baseline), or on just primates?). Hence values of EQ or CBS in the literature
range widely; I've seen
between about 4 - 8 for humans (one of, if not the most, encephalized
animals). Just be careful when
comparing results across studies, and read the methods carefully!
Hopefully that will clarify what log-log plots and allometric relationships are
all about (see Harvey
et al. (1987) for additional discussion and data). Now for a couple of the
problems
with this approach.
- 1) The data points themselves.
- A species doesn't have a
body, or a brain.
How many specimens were measured? Zoo animals (often obese)? Sexual dimorphism? Geographical or racial variability? No easy
answers. Read the
methods sections of papers!
- 2) The "part/whole" problem.
- Properly speaking, we are
wrong to correlate
brain weight with total body weight, because total body weight
includes brain weight and so
artificially strengthens the correlation between the "two" variables. Primate
brains aren't usually
such a large proportion of the body weight that this bias is important, but if
you were interested in
e.g., muscle mass, clearly you'd want to compare muscle mass not with body
weight, but with the
weight of everything left with muscle removed (messy research, that). And it
may turn out
to be an important problem for brain allometry...
- 3) "Galton's problem."
-
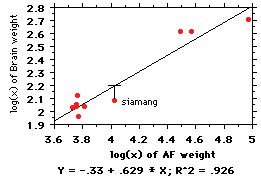 Galton was one of the first
to use regressions in biology, and he had a
problem that we still have: independence
of the points. It's best illustrated with an
example: Let's say we are interested in
brain:body relationships among the apes;
the log:log regression is shown at right.
Note there are 6 species of gibbon, 1
siamang, and chimps, orangs, and gorillas.
The regression line fitting these points is
y= (-.33) + .629(x) (note
that the coefficient, 0.629, is less than
the 0.822 found above for primates--
illustrating the point about lower slopes
as one gets narrower taxonomically). But
when you think about it, those 6 species of
gibbon are just local varieties of the same animal, eating the same things,
with the same social
organization, etc. Those 6 points are not independent of each
other; it is just sort
of a biogeographic historical accident that there are so many species (maybe...
).
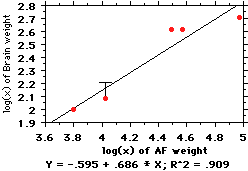 This figure shows what happens when you
average the 6 gibbons together. The
change isn't big, but it's there (note the
"T" bar on the point representing
siamangs, illustrating how the distance
between the point and line has shifted--in
effect, siamangs have gotten "less small-
brained" because we pooled the gibbons).
The problem is deciding which
species are "independent." EG guenons:
many species, many just allopatric
versions of each other; BUT there are
sympatric ones that clearly are
"different" in what may be important ways
(cf. multimale, semiterrestrial vervets
and unimale,
arboreal redtails at Kibale). If it was just allopatry & sympatry, no problems;
but what about
sympatric Kibale redtails and blue monkeys (which sometimes interbreed)?
Harvey et al.
(1987) discuss the problem (& their solution) in the top right column of p.
182.
- 4) Interpretation--What does it MEAN?
- Harvey et al. conclude
that the
brain-body slope is based on BMR because "When the analysis is repeated
with Homo
removed, the exponent is reduced such that 0.75 lies within its 95%
confidence limits (see Table
16-3)" (p. 187); valid conclusion, but those confidence limits are 0.74 - 0.99 --
0.75 sure isn't
FAR within that range. Their method is better than Jerison's (fitting a line by
eye to reflect the
theory he liked) but it isn't clear that the issue is solved (attention has been
turning to the
relationship between mother's BMR and relative brain size of newborns).
Or: if you code primates by diet as folivores (primarily leaf eaters) or
frugivores (primarily fruit
eaters) and then regress brain on body size, the folivore species tend to fall
below the line--that
is, they tend to have lower EQs than frugivores. The relatively small brains of
folivores have been
used to argue that ecological pressures have been important in the evolution
of intelligence. BUT:
that assumes relative brain size is a measure of intelligence
(comparing DIFFERENT
SPECIES, it seems to hold). And it assumes nothing else is "going on";
several problems
with that assumption have been pointed out: (a) folivores may have
lower BMRs, and this
may be responsible for their brain size, not any lack of need for intelligence;
(b) folivores
have big guts, normally full of fermenting leaves; weight may be misleading
by "artificially"
increasing body size and hence lowering relative brain size. Could try length,
but that is sensitive
to body build. How can we compare fat folivores with skinny frugivores?
A sampler of references in case you want to pursue this (hey, someone
might):
- Deacon, T. W. (1988). Human brain evolution: II. Embryology and brain
allometry. pp. 383-415 IN Jerison, H. J. & Jerison, I. (Ed.), Intelligence and
Evolutionary Biology. Berlin: Springer-Verlag.
- Deacon, T. W. (1990). Fallacies of progression in theories of brain-size
evolution. Int. J. Primatol. 11: 193-236.
- Gould, S. J. (1975). Allometry in primates with emphasis on scaling and
the evolution of the brain. Contr. Primatol. 5: 244-292.
- Harvey, P. H. (1990). Life-history variation: size and mortality patterns.
pp. 81-88 IN DeRousseau, C. J. (Ed.), Primate Life History and Evolution.
New York: Wiley-Liss.
- Harvey, P. H., Martin, R. D. & Clutton-Brock, T. H. (1987). Life histories in
comparative perspective. pp. 181-196 IN Smuts, B. B., Cheney, D. L., Seyfarth,
R.
M., Struhsaker, T. T. & Wrangham, R. W. (Ed.), Primate Societies.
Chicago:
University of Chicago Press.
- Harvey, P. H. & Pagel, M. D. (1991). The Comparative Method in
Evolutionary Biology. Oxford: Oxford University Press.
- Holloway, R. (1979). Brain size, allometry, and reorganization: Toward a
synthesis. pp. 59-88 IN Hahn, M. E. & al, e. (Ed.), Development and
Evolution of
Brain Size. New York: Academic Press.
- Jerison, H. F. (1983). The evolution of the mammalian brain as an
information-processing system. pp. 113-146 IN Eisenberg, J. F. & Kleiman, D.
G.
(Ed.), Advances in the Study of Mammalian Behavior (Spec. Publ. Amer.
Soc.
Mamm. 7). Pittsburgh: American Society of Mammalogists.
- Jerison, H. J. (1979). The evolution of diversity in brain size. pp. 29-57
IN
Hahn, M. E. & al, e. (Ed.), Development and Evolution of Brain Size. New
York: Academic Press.
- Leroi, A. M., Rose, M. R. & Lauder, G. V. (1994). What does the
comparative
method reveal about adaptation? Am. Nat. 143: 381-402.
- Martin, R. D. & Harvey, P. H. (1985). Brain size allometry: ontogeny and
phylogeny. pp. 147-173 IN Jungers, W. L. (Ed.), Size and Scaling in Primate
Biology. New York: Plenum.
- Martin, R. D. & MacLarnon, A. M. (1990). Reproductive patterns in
primates
and other mammals: the dichotomy between altricial and precocial offspring.
pp.
47-79 IN DeRousseau, C. J. (Ed.), Primate Life History and Evolution.
New
York: Wiley-Liss.
- Ross, C. (1992). Basal metabolic rate, body weight and diet in primates:
an evaluation of the evidence. Folia primatol. 58: 7-23.
- Sawaguchi, T. (1992). The size of the neocortex in relation to ecology
and
social structure in monkeys and apes. Folia primatol. 58: 131-
145.
- Smith, R. J. (1993). Logarithmic transformation bias in allometry. Am.
J. Phys. Anthropol. 90: 215-228.
Back to course handout menu
Back to Moore's home page
Jump to overview of BioAnthro at UCSD &
elsewhere
Uploaded: 1 Oct 1999
revised 5 Oct 2000 -- thanks to Graham Horgan for feedback!
 Here is a plot of the data for 117 species;
adult females were used because it
simplifies how one deals with sexual
dimorphism, and for various theoretical
reasons female mammals are thought to be
the "ecological sex", with males more a
derived form of females (driven by sexual
selection). Here is what the data look like;
note that body weight is given in kilos
(1,000 gm) - so multiply the body
weights by 1,000 to get them into the same
units as brain weights.
 Well, why not do a regression of
brain size on body size? There are several
methods for calculating a regression (see
below), but the principle is simple: it is a
line of best fit between the
variables. And the line itself can be
described by a simple equation of the form

 So we convert the raw data to base-10 logs,
as in the figure at left (note units need to
be the same, so body weight is now in
grams). As you can see, when the
data are expressed as logs, they fit a nice
easy linear equation, the points are spread
out so we can see what is going on, and the
R2 value is essentially
unchanged (the slight difference between
0.889 in the untransformed data and the
0.884 here is due to the transformation; don't worry about it, it is small).

 One
of the first and most widely cited allometric
analyses is Jerison's work on relative brain size
in vertebrates. In the figure at left (from Jerison 1983), you can trace
the two lines backward to see that they in fact
intercept the Y-axis at 0.07 and 0.007, as
SHOULD be indicated by the allometric
coefficients in the equations (the lower 0.07
is a typo that does not appear in the original 1973
paper; it pays to read critically!). The ten-fold
difference in intercept supposedly reflects a
difference in grade; the "lower" vertebrates doing
something fundamentally different from the
"higher" vertebrates in terms of brain/body
allocation. However, the slopes shown are equal
(allometric exponent = 2/3, or 0.667),
indicating that within each grade, the same set of
rules apply to how the brain is scaled with respect to body size. Since 0.67 is
the exponent for surface
area:volume relationships in solids, and there is a plausible argument for
surface area being
functionally related to the nervous system's basic requirements, this suggests
that relative brain size
in vertebrates is "driven" by body surface area (rather than being, say, a
simple isometric
relationship), with "higher" vertebrates applying the same relationship but
"scaled up" to reflect
overall greater emphasis on intelligence.
 Galton was one of the first
to use regressions in biology, and he had a
problem that we still have: independence
of the points. It's best illustrated with an
example: Let's say we are interested in
brain:body relationships among the apes;
the log:log regression is shown at right.
Note there are 6 species of gibbon, 1
siamang, and chimps, orangs, and gorillas.
The regression line fitting these points is
y= (-.33) + .629(x) (note
that the coefficient, 0.629, is less than
the 0.822 found above for primates--
illustrating the point about lower slopes
as one gets narrower taxonomically). But
when you think about it, those 6 species of
gibbon are just local varieties of the same animal, eating the same things,
with the same social
organization, etc. Those 6 points are not independent of each
other; it is just sort
of a biogeographic historical accident that there are so many species (maybe...
).
 This figure shows what happens when you
average the 6 gibbons together. The
change isn't big, but it's there (note the
"T" bar on the point representing
siamangs, illustrating how the distance
between the point and line has shifted--in
effect, siamangs have gotten "less small-
brained" because we pooled the gibbons).
The problem is deciding which
species are "independent." EG guenons:
many species, many just allopatric
versions of each other; BUT there are
sympatric ones that clearly are
"different" in what may be important ways
(cf. multimale, semiterrestrial vervets
and unimale,
arboreal redtails at Kibale). If it was just allopatry & sympatry, no problems;
but what about
sympatric Kibale redtails and blue monkeys (which sometimes interbreed)?
Harvey et al.
(1987) discuss the problem (& their solution) in the top right column of p.
182.